
Social and Behavior Change Flow Chart
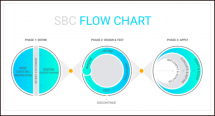
The Social and Behavior Change (SBC) Flow Chart is a new process used to develop effective SBC activities. The Flow Chart process actively and meaningfully engages end-users and stakeholders from start to finish, ensuring true co-creation. It harnesses the Breakthrough ACTION consortium partner disciplines (i.e., design, behavioral science, community engagement, market research, and communication) into a new hybrid process that has its roots in the P Process, the human-centered design and behavioral economics design processes, and the Community Action Cycle. The three phases—Define, Design & Test, and Apply—offer project managers a process to more deeply explore and understand context, formulate insights that uncover new truths, build new designs with community members, and test and iterate on locally made designs. Real-time monitoring is the key to ensuring designs are implemented at scale with intended results. Borrowing heavily from human-centered design principles, the SBC Flow Chart requires users to adopt a beginner’s mind to identify new insights to solve sticky public health problems.
The SBC Flow Chart Introduction outlines the disciplines, explains their underpinning methodologies, and explores the tools and techniques that comprise the Flow Chart phases. The country Spotlights showcase how Breakthrough ACTION has used the SBC Flow Chart to address health problems in various countries.
Learn More About SBC
Explore the power of SBC with our toolkit trio:
- Implementing the SBC Flow Chart [Toolkit]
- SBC 101: An Introduction [Course]
- Insights 101 Playbook [PDF]
These tools are crafted to empower SBC practitioners in seamlessly integrating formative research at the define phase to drive informed decisions during the Design & Test and Apply Phases. This guides the creation and implementation of SBC solutions that truly make an impact.
EN FRANÇAIS
Mettre en oeuvre le diagramme du CSC [Boîte à outils]
Manuel des découvertes clés 101 [PDF]
Last modified: May 4, 2021
Language: English