
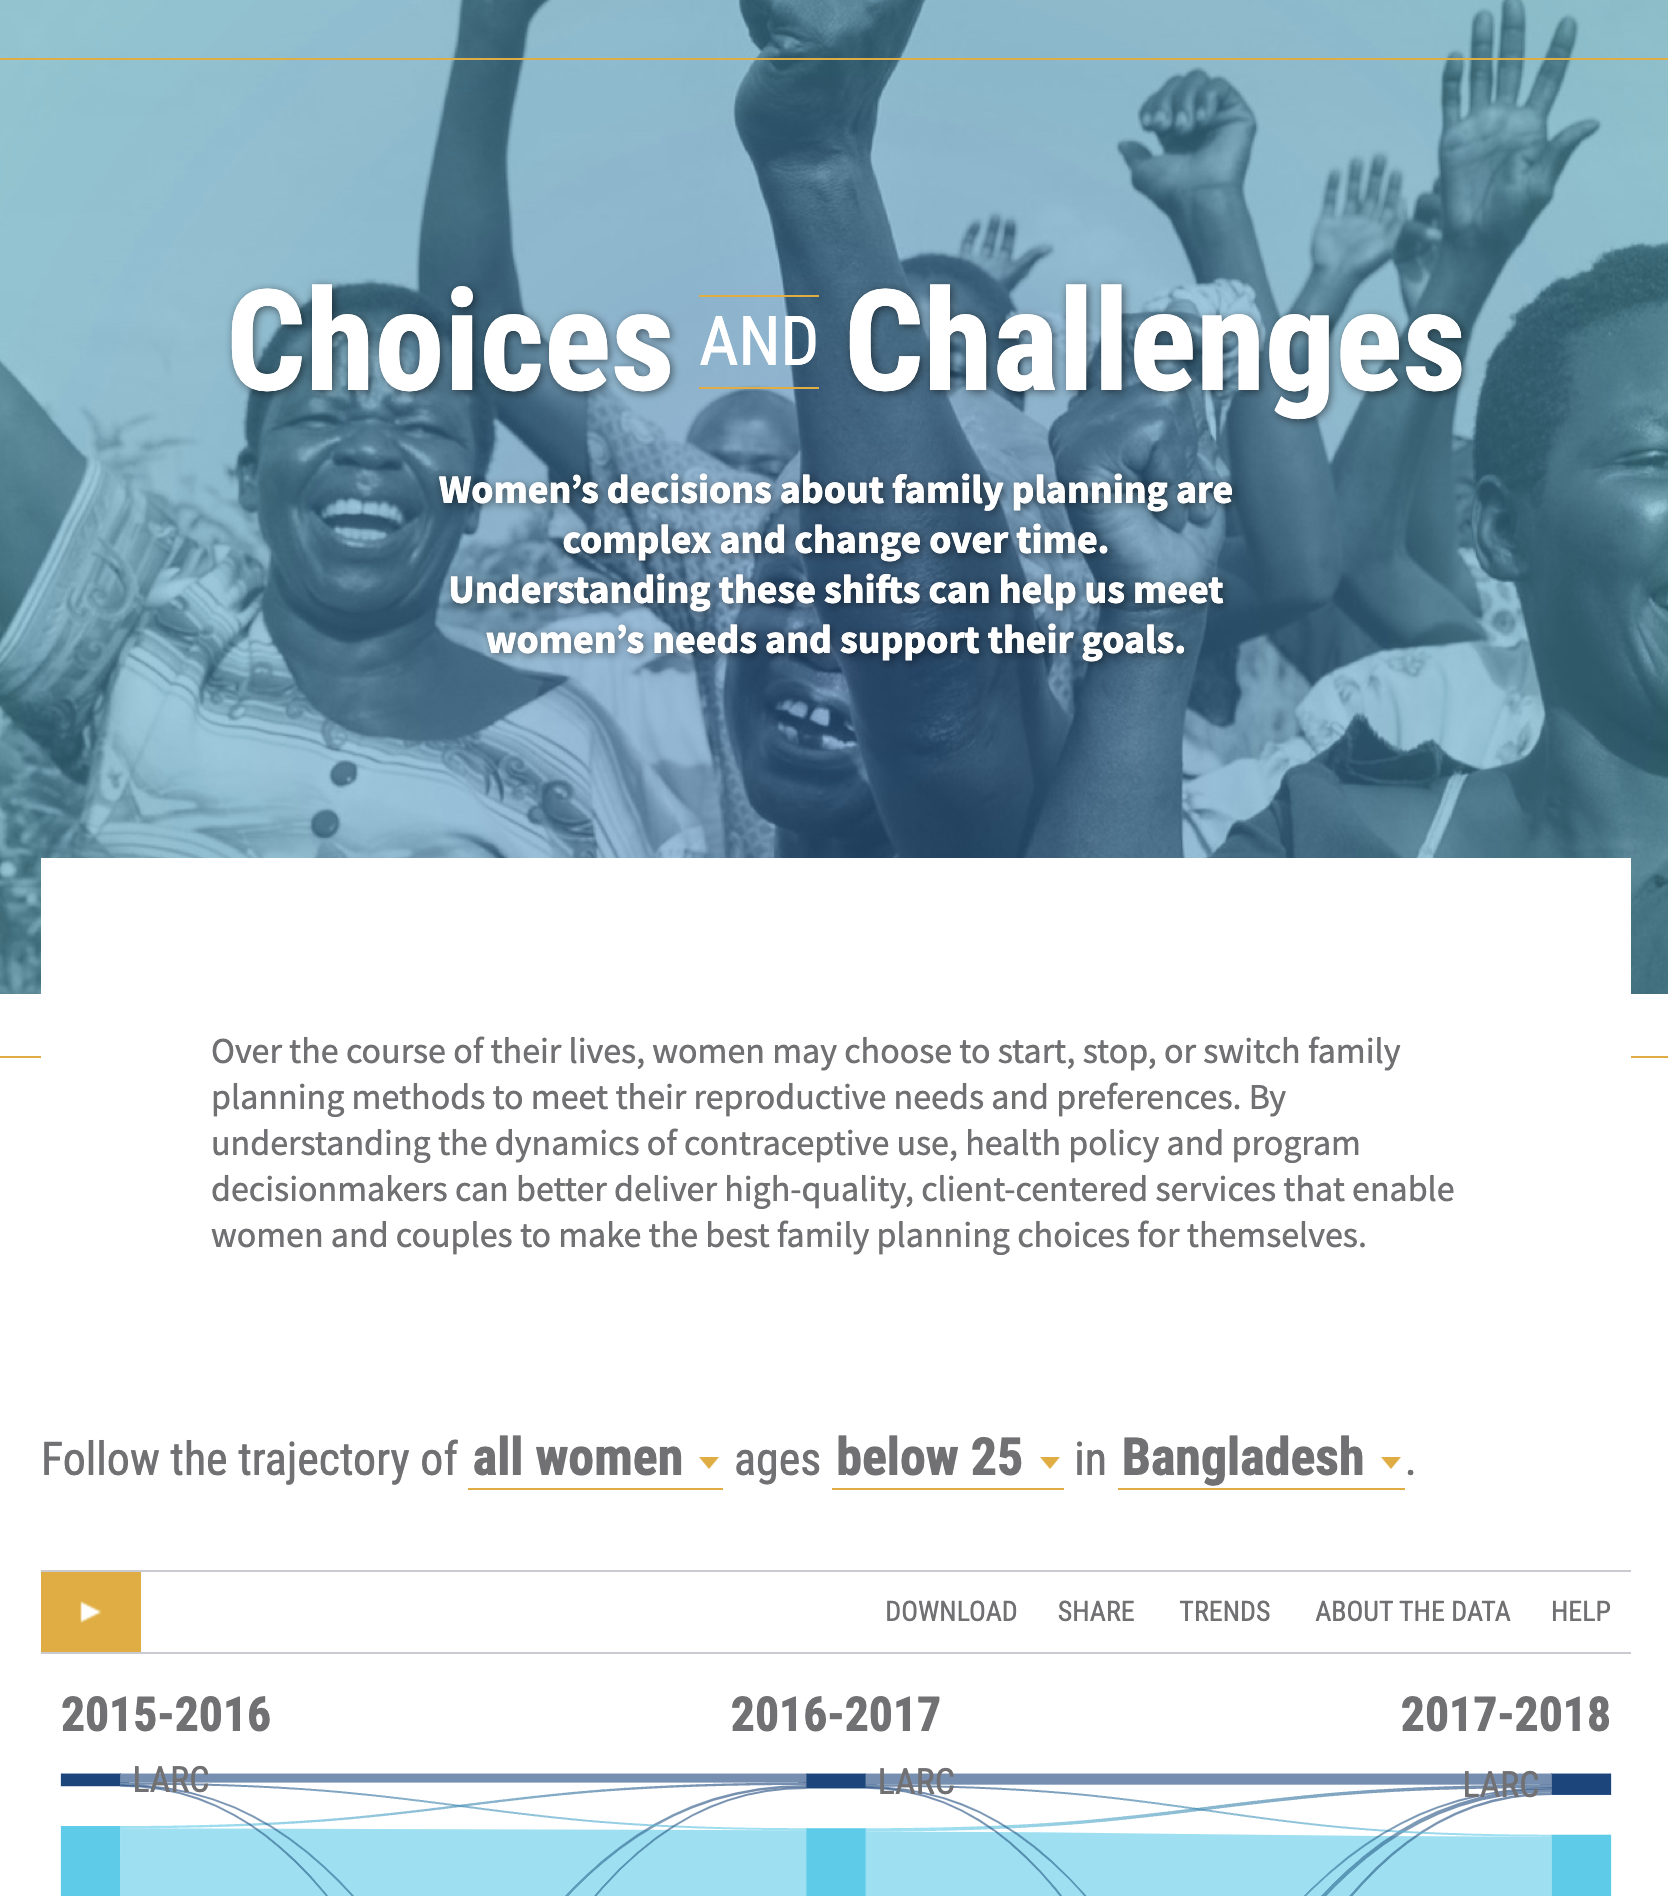
Choices and Challenges
This interactive tool (Sankey Diagram) helps users visualize and explore trends in contraceptive discontinuation and switching over a two-year period. It presents data from 15 countries across Asia and Africa.
Source: Population Reference Bureau
Date of Publication: September 1, 2022