Introduction

Audience segmentation is a key activity within an audience analysis. It is the process of dividing a large audience into smaller groups of people – or segments – who have similar needs, values or characteristics. Segmentation recognizes that different groups will respond differently to social and behavior change communication (SBCC) messages and interventions.

Why Segment an Audience?

Segmenting audiences enables a program to focus on those audience members who are most critical to reach and also to design the most effective and efficient strategy for helping each audience adopt new behaviors. Audience segmentation enables programs to match audiences, messages, media, products and services based on the specific needs and preferences of the audience. Tailoring an SBCC strategy to the characteristics, needs and values of important audience segments improves the chances for desired behavior change.

Who Should Conduct an Audience Segmentation?

A small, focused team should conduct the audience segmentation. Members should include communication staff, health/social service staff and, when available, research staff. Typically, the same team conducting the audience analysis will also conduct the audience segmentation.

When Should an Audience Segmentation Take Place?

Audience segmentation takes place during audience analysis. To gain stakeholder input, the audience segmentation can also be part of the stakeholders’ workshop.

Estimated Time Needed

Within audience analysis, audience segmentation can be completed in a few hours.

Learning Objectives

After completing the activities in the audience segmentation guide, the team will:

  • Define the audience segments for a particular health issue.
  • Select an appropriate audience segment for the intervention.

Prerequisites

Steps

Step 1: Review Audience Information

Review the information collected on the primary audience(s) during the situation analysis and audience analysis. This information will help the team understand whether and how best to segment the audience(s). The team should review:

  • How each audience is affected by the problem
  • Demographics
  • Size (number of people in the audience)
  • Knowledge and behaviors
  • Psychographics
  • Other information as appropriate.

Step 2: Decide Whether to Segment

Based on the audience(s) identified and their characteristics, first determine whether segmentation is necessary. Segmentation is recommended if:

  • The audience cannot be reached effectively with the same messages, interventions and channels. The audience (i.e. sexually active youth) may require different messages, interventions, or channels if:
  1. Certain segments are more heavily impacted by the problem (e.g. orphan girls are more likely to contract HIV)
  2. Certain segments have significantly different worldviews, needs or concerns (e.g. sexually active, urban boys view sex as a power symbol while sexually active young girls view sex as a means to receiving gifts)
  3. Certain segments are more difficult to reach (e.g. homeless sexually active youth do not have access to TV and need to be reached through community workers)
  • The program has a budget that allows for multiple approaches. Segmentation requires extra effort and resources (e.g. time to properly segment audiences, funds and staff time to design separate messages and materials, funds to use additional channels). If the budget does not allow for multiple approaches, identify the most important audience segment to reach and focus on that segment.

Step 3: Determine Segmentation Criteria

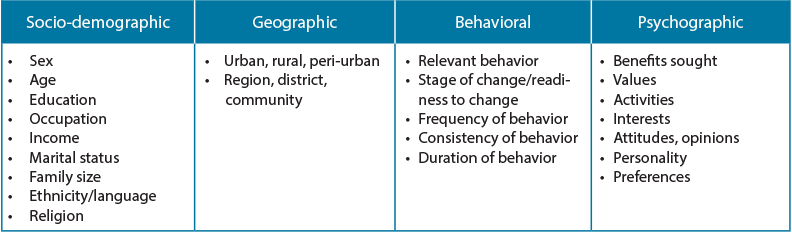
If it makes sense to segment, then the team needs to decide what criteria to use to segment the audience(s). First, look at the primary audience(s) and identify traits that make a subgroup significantly different from other audience members. A significant difference is one that requires a different messages or approach. These differences are typically based on socio-demographic, geographic, behavioral or psychographic differences among members of the primary audience.

Step 4: Segment Audiences

Segment the audience by using the criteria identified in Step 3. There are various methods teams can use to segment audiences.

One option is to use a segmentation table. In Column 1, list the primary audience(s) chosen during the audience analysis. For each audience, identify potential segments based on the criteria from Step 3.

Adapted from A Field Guide to Designing a Health Communication Strategy

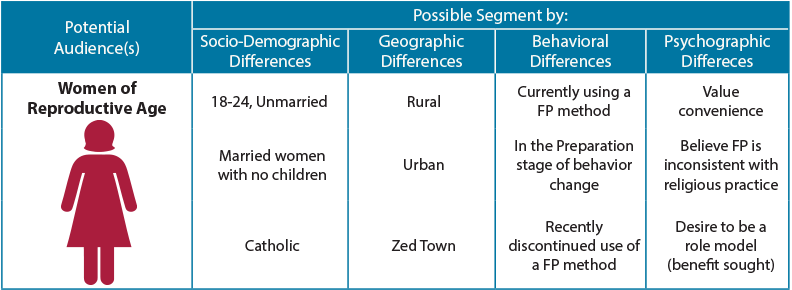
Another option is to create a segmentation tree, starting with a potential audience and dividing it by differences thought to be important. Stop when the need or ability to target differences ends. The example below presents one line of a segmentation tree for women of reproductive age.

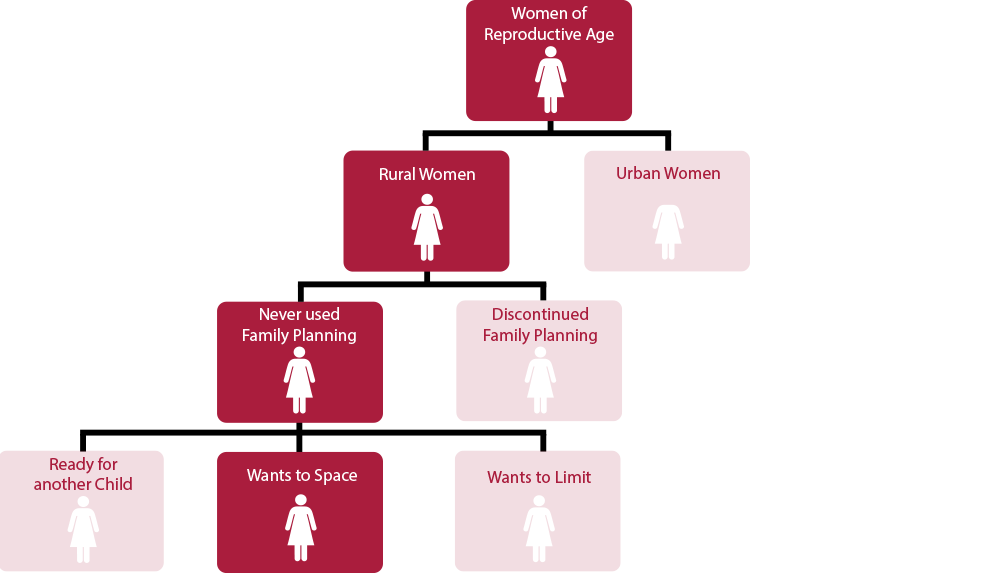
A complete segmentation table or tree highlights potential audience segments. In the examples above, many segments are identified, including: current FP users, urban dwellers, women who value convenience, and women who want to space children. The program team now needs to determine which segments it should prioritize.

Step 5: Decide which Segments to Target

Deciding which segments to target and how to approach them is critical. If the program team identified more audience segments than it can or needs to reach, narrow the list. Here are some suggestions on how to narrow the list:

  • Impact: Look at the size of the segment and ask whether behavior change in this segment will have a significant impact on the problem. For example, will focusing on women with no children significantly increase contraceptive use and decrease maternal mortality? Are there enough women without children to make a difference?
  • Accessibility: Determine whether the program team is able to reach the particular segment with the resources available. For example, does the program team have connections with the rural audience? Can it work with rural leaders to ensure its message is delivered?
  • Program priorities: Programs often need to show impact early and quickly. In such cases, it may be necessary to choose audience segments whose behavior will be relatively easy to change. For example, the team may need to focus first on those who are already thinking about making a change (in the Preparation stage of behavior change) and then focus on harder-to-reach segments—requiring more time and effort—later in the program.

Using the suggestions above, finalize which segments the program will target. The number of segments will be based largely on the resources available and program goals.

Step 6: Assess the Proposed Segments

Once segments have been selected, ensure they are valid and usable. Use a checklist to ensure each segment meets the criteria for effective segmentation (see Audience Segmentation Checklist in templates). If a defined segment does not meet the criteria, it is best to drop it and consider other segments.

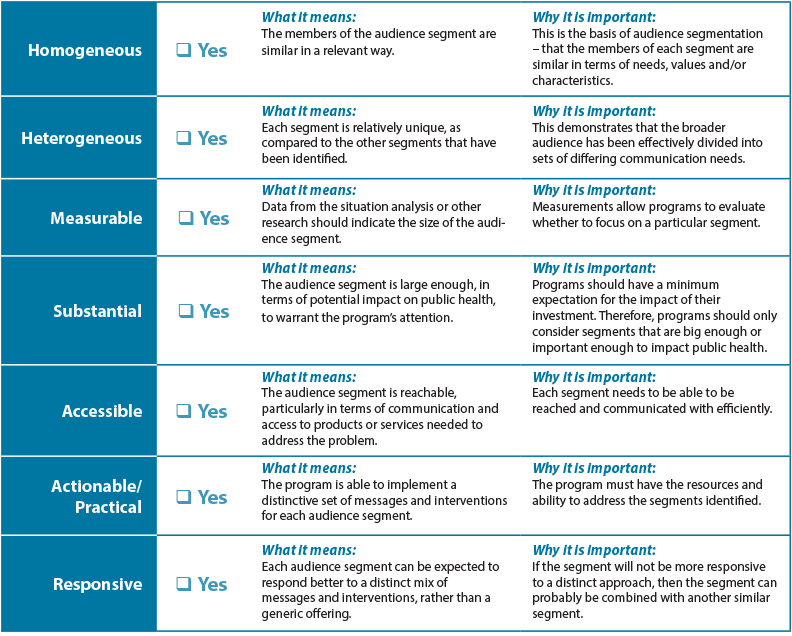
Adapted from Criteria for Market Segmentation

Step 7: Develop Audience Profiles

The audience analysis guide outlines how to develop audience profiles. Profiles might need to be refined or added based on further audience segmentation. Write the creative brief with the profile for each segment in mind.

Templates

Audience Segmentation Checklist

Tips & Recommendations

  • Ensure the program has resources to address multiple segments before engaging in the process of segmentation.
  • Look for ways to leverage funds with other programs so that additional segments can be reached with tailored messages and interventions.

Lessons Learned

  • Ensure that the segments chosen are different enough to warrant different messages and interventions.

Resources and References

Resources

A Field Guide to Designing a Health Communication Strategy

Segmenting the Market to Reach the Targeted Population

Market Segmentation Study Guide

Audience Segmentation Guide

References


Banner Photo: © 2014 Basil Safi, Courtesy of Photoshare

Introduction

Click here to access this Guide in Arabic

لمراجعة هذا الدليل باللغة العربية، انقر هنا

What is a Monitoring and Evaluation Plan?

A monitoring and evaluation (M&E) plan is a document that helps to track and assess the results of the interventions throughout the life of a program. It is a living document that should be referred to and updated on a regular basis. While the specifics of each program’s M&E plan will look different, they should all follow the same basic structure and include the same key elements.

An M&E plan will include some documents that may have been created during the program planning process, and some that will need to be created new. For example, elements such as the logic model/logical framework, theory of change, and monitoring indicators may have already been developed with input from key stakeholders and/or the program donor. The M&E plan takes those documents and develops a further plan for their implementation.

Why develop a Monitoring and Evaluation Plan?

It is important to develop an M&E plan before beginning any monitoring activities so that there is a clear plan for what questions about the program need to be answered. It will help program staff decide how they are going to collect data to track indicators, how monitoring data will be analyzed, and how the results of data collection will be disseminated both to the donor and internally among staff members for program improvement. Remember, M&E data alone is not useful until someone puts it to use! An M&E plan will help make sure data is being used efficiently to make programs as effective as possible and to be able to report on results at the end of the program.

Who should develop a Monitoring and Evaluation Plan?

An M&E plan should be developed by the research team or staff with research experience, with inputs from program staff involved in designing and implementing the program.

When should a Monitoring and Evaluation Plan be developed?

An M&E plan should be developed at the beginning of the program when the interventions are being designed. This will ensure there is a system in place to monitor the program and evaluate success.

Who is this guide for?

This guide is designed primarily for program managers or personnel who are not trained researchers themselves but who need to understand the rationale and process of conducting research. This guide can help managers to support the need for research and ensure that research staff have adequate resources to conduct the research that is needed to be certain that the program is evidence based and that results can be tracked over time and measured at the end of the program.

Learning Objectives

After completing the steps for developing an M&E plan, the team will:

  1. Identify the elements and steps of an M&E plan
  2. Explain how to create an M&E plan for an upcoming program
  3. Describe how to advocate for the creation and use of M&E plans for a program/organization

Estimated Time Needed

Developing an M&E plan can take up to a week, depending on the size of the team available to develop the plan, and whether a logic model and theory of change have already been designed.

Prerequisites

How to Develop a Logic Model

Steps

Step 1: Identify Program Goals and Objectives

The first step to creating an M&E plan is to identify the program goals and objectives. If the program already has a logic model or theory of change, then the program goals are most likely already defined. However, if not, the M&E plan is a great place to start. Identify the program goals and objectives.

Defining program goals starts with answering three questions:

  1. What problem is the program trying to solve?
  2. What steps are being taken to solve that problem?
  3. How will program staff know when the program has been successful in solving the problem?

​Answering these questions will help identify what the program is expected to do, and how staff will know whether or not it worked. For example, if the program is starting a condom distribution program for adolescents, the answers might look like this:

ProblemHigh rates of unintended pregnancy and sexually transmitted infections (STIs) transmission among youth ages 15-19
SolutionPromote and distribute free condoms in the community at youth-friendly locations
SuccessLowered rates of unintended pregnancy and STI transmission among youth 15-19. Higher percentage of condom use among sexually active youth.

From these answers, it can be seen that the overall program goal is to reduce the rates of unintended pregnancy and STI transmission in the community.

It is also necessary to develop intermediate outputs and objectives for the program to help track successful steps on the way to the overall program goal. More information about identifying these objectives can be found in the logic model guide.

Step 2: Define Indicators

Once the program’s goals and objectives are defined, it is time to define indicators for tracking progress towards achieving those goals. Program indicators should be a mix of those that measure process, or what is being done in the program, and those that measure outcomes.

Process indicators track the progress of the program. They help to answer the question, “Are activities being implemented as planned?” Some examples of process indicators are:

  • Number of trainings held with health providers
  • Number of outreach activities conducted at youth-friendly locations
  • Number of condoms distributed at youth-friendly locations
  • Percent of youth reached with condom use messages through the media

Outcome indicators track how successful program activities have been at achieving program objectives. They help to answer the question, “Have program activities made a difference?” Some examples of outcome indicators are:

  • Percent of youth using condoms during first intercourse
  • Number and percent of trained health providers offering family planning services to youth
  • Number and percent of new STI infections among youth.

These are just a few examples of indicators that can be created to track a program’s success. More information about creating indicators can be found in the How to Develop Indicators guide.

Step 3: Define Data Collection Methods and TImeline

After creating monitoring indicators, it is time to decide on methods for gathering data and how often various data will be recorded to track indicators. This should be a conversation between program staff, stakeholders, and donors. These methods will have important implications for what data collection methods will be used and how the results will be reported.

The source of monitoring data depends largely on what each indicator is trying to measure. The program will likely need multiple data sources to answer all of the programming questions. Below is a table that represents some examples of what data can be collected and how.

Information to be collectedData source(s)
Implementation process and progressProgram-specific M&E tools
Service statisticsFacility logs, referral cards
Reach and success of the program intervention within audience subgroups or communitiesSmall surveys with primary audience(s), such as provider interviews or client exit interviews
The reach of media interventions involved in the programMedia ratings data, brodcaster logs, Google analytics, omnibus surveys
Reach and success of the program intervention at the population levelNationally-representative surveys, Omnibus surveys, DHS data
Qualitative data about the outcomes of the interventionFocus groups, in-depth interviews, listener/viewer group discussions, individual media diaries, case studies

Once it is determined how data will be collected, it is also necessary to decide how often it will be collected. This will be affected by donor requirements, available resources, and the timeline of the intervention. Some data will be continuously gathered by the program (such as the number of trainings), but these will be recorded every six months or once a year, depending on the M&E plan. Other types of data depend on outside sources, such as clinic and DHS data.

After all of these questions have been answered, a table like the one below can be made to include in the M&E plan. This table can be printed out and all staff working on the program can refer to it so that everyone knows what data is needed and when.

IndicatorData source(s)Timing
Number of trainings held with health providersTraining attendance sheetsEvery 6 months
Number of outreach activities conducted at youth-friendly locationsActivity sheetEvery 6 months
Number of condoms distributed at youth-friendly locationsCondom distribution sheetEvery 6 months
Percent of youth receiving condom use messages through the mediaPopulation-based surveysAnnually
Percent of adolescents reporting condom use during first intercourseDHS or other population-based surveyAnnually
Number and percent of trained health providers offering family planning services to adolescentsFacility logsEvery 6 months
Number and percent of new STI infections among adolescentsDHS or other population-based surveyAnnually

Step 4: Identify M&E Roles and Responsibilities

The next element of the M&E plan is a section on roles and responsibilities. It is important to decide from the early planning stages who is responsible for collecting the data for each indicator. This will probably be a mix of M&E staff, research staff, and program staff. Everyone will need to work together to get data collected accurately and in a timely fashion.

Data management roles should be decided with input from all team members so everyone is on the same page and knows which indicators they are assigned. This way when it is time for reporting there are no surprises.

An easy way to put this into the M&E plan is to expand the indicators table with additional columns for who is responsible for each indicator, as shown below.

IndicatorData source(s)TimingData manager
Number of trainings held with health providersTraining attendance sheetsEvery 6 monthsActivity manager
Number of outreach activities conducted at youth-friendly locationsActivity sheetEvery 6 monthsActivity manager
Number of condoms distributed at youth-friendly locationsCondom distribution sheetEvery 6 monthsActivity manager
Percent of youth receiving condom use messages through the mediaPopulation-based surveyAnnuallyResearch assistant
Percent of adolescents reporting condom use during first intercourseDHS or other population-based surveyAnnuallyResearch assistant
Number and percent of trained health providers offering family planning services to adolescentsFacility logsEvery 6 monthsField M&E officer
Number and percent of new STI infections among adolescentsDHS or other population-based surveyAnnuallyResearch assistant

Step 5: Create an Analysis Plan and Reporting Templates

Once all of the data have been collected, someone will need to compile and analyze it to fill in a results table for internal review and external reporting. This is likely to be an in-house M&E manager or research assistant for the program.

The M&E plan should include a section with details about what data will be analyzed and how the results will be presented. Do research staff need to perform any statistical tests to get the needed answers? If so, what tests are they and what data will be used in them? What software program will be used to analyze data and make reporting tables? Excel? SPSS? These are important considerations.

Another good thing to include in the plan is a blank table for indicator reporting. These tables should outline the indicators, data, and time period of reporting. They can also include things like the indicator target, and how far the program has progressed towards that target. An example of a reporting table is below.

IndicatorBaselineYear 1Lifetime target% of target achieved
Number of trainings held with health providers051050%
Number of outreach activities conducted at youth-friendly locations02633%
Number of condoms distributed at youth-friendly locations025,00050,00050%
Percent of youth receiving condom use messages through the media.5%35%75%47%
Percent of adolescents reporting condom use during first intercourse20%30%80%38%
Number and percent of trained health providers offering family planning services to adolescents2010625080%
Number and percent of new STI infections among adolescents11,00022%10,00020%10% reduction 5 years20%

Step 6: Plan for Dissemination and Donor Reporting

The last element of the M&E plan describes how and to whom data will be disseminated. Data for data’s sake should not be the ultimate goal of M&E efforts. Data should always be collected for particular purposes.

Consider the following:

  • How will M&E data be used to inform staff and stakeholders about the success and progress of the program?
  • How will it be used to help staff make modifications and course corrections, as necessary?
  • How will the data be used to move the field forward and make program practices more effective?

The M&E plan should include plans for internal dissemination among the program team, as well as wider dissemination among stakeholders and donors. For example, a program team may want to review data on a monthly basis to make programmatic decisions and develop future workplans, while meetings with the donor to review data and program progress might occur quarterly or annually. Dissemination of printed or digital materials might occur at more frequent intervals. These options should be discussed with stakeholders and your team to determine reasonable expectations for data review and to develop plans for dissemination early in the program. If these plans are in place from the beginning and become routine for the project, meetings and other kinds of periodic review have a much better chance of being productive ones that everyone looks forward to.

Conclusion

After following these 6 steps, the outline of the M&E plan should look something like this:

  1. Introduction to program
    • ​Program goals and objectives
    • Logic model/Logical Framework/Theory of change
  2. ​​Indicators
    • Table with data sources, collection timing, and staff member responsible
  3. Roles and Responsibilities
    • Description of each staff member’s role in M&E data collection, analysis, and/or reporting
  4. ​Reporting
    • Analysis plan
    • Reporting template table
  5. Dissemination plan
    • Description of how and when M&E data will be disseminated internally and externally

Templates

M&E Planning: Template for Indicator Reporting

M&E Plan Indicators Table Template

Samples

M&E Plan: Data Sources Table Example

Tips & Recommendations

  • It is a good idea to try to avoid over-promising what data can be collected. It is better to collect fewer data well than a lot of data poorly. It is important for program staff to take a good look at the staff time and resource costs of data collection to see what is reasonable.

Glossary & Concepts

  • Process indicators track how the implementation of the program is progressing. They help to answer the question, “Are activities being implemented as planned?”
  • Outcome indicators track how successful program activities have been at achieving program goals. They help to answer the question, “Have program activities made a difference?”

Resources and References

References

Evaluation Toolbox. Step by Step Guide to Create your M&E Plan. Retrieved from: http://evaluationtoolbox.net.au/index.php?option=com_content&view=article&id=23:create-m-and-e-plan&catid=8:planning-your-evaluation&Itemid=44

infoDev. Developing a Monitoring and Evaluation Plan for ICT for Education. Retrieved from: https://www.infodev.org/infodev-files/resource/InfodevDocuments_287.pdf

FHI360. Developing a Monitoring and Evaluation Work Plan. Retrieved from: http://www.fhi360.org/sites/default/files/media/documents/Monitoring%20HIV-AIDS%20Programs%20(Facilitator)%20-%20Module%203.pdf


Banner Photo: © 2012 Akintunde Akinleye/NURHI, Courtesy of Photoshare

Introduction

What is an indicator?

Indicators are tools used to measure Social Behavior Change Communication (SBCC) program progress. They are used to assess the state of a program by defining its characteristics or variables, and then tracking changes in those characteristics over time or between groups. Clear indicators are the basis of any effective monitoring and evaluation system.

Why are indicators necessary?

In order to track the way in which an SBCC program evolves and its progress towards reaching certain goals you need to be able to measure this change over time. Indicators provide data that can be measured to show changes in relevant SBCC program areas.

While partners in the community and key stakeholders will help design an SBCC program, it is ultimately the responsibility of the organization to assess its success and report results to the donor. Indicators are used to create targets that allow program staff to measure up-to-date characteristics of the program’s success and assess whether those results are in line with program expectations. The indicators themselves are vital to this process, as they are the key for successful tracking of program changes or problems.

As a tracking device indicators alert managers to any needed mid-course adjustments if it is found that the program is having unexpected difficulties or going off track. At the end of the program they are measured to validate the success and achievements of the intervention.

Who should develop indicators?

Indictors should be developed by the research staff in close collaboration with program staff and any government or NGO counterparts who are designing the program and have clear knowledge of the program goals and objective. Once agreed uppn, indicators give all parties, program managers and personnel, researchers and key stakeholders, a common framework against which to measure the progress and success of the program over time.

When should indicators be developed?

Indicators should be developed at the beginning of SBCC programs and can help researchers and program managers track program progress over the life of the program as well as measuring the results of the program at the end.

Who is this guide for?

This guide is designed primarily for program managers or personnel who are not trained researchers themselves but who need to understand the rationale and process of conducting research. This guide can help managers to support the need for research and ensure that research staff have adequate resources to conduct the research that is needed to be certain that the program is evidence based and that results can be tracked over time and measured at the end of the program.

Learning Objectives

After completing the steps in the indicators guide, the team will:

1. Explain how to create indicators

2. Identify when to use indicators

3. Know how to set baselines and targets using indicators

Prerequisites

How to Develop a Logic Model and/or How to Develop a Theory of Change

How to Develop a Monitoring and Evaluation Plan

Steps

Step 1: Identify What to Measure

The first step to creating program indicators for monitoring and evaluation is to determine which characteristics of the program are most important to track. A program will use many indicators to assess different types and levels of change that result from the intervention, like changes in certain health knowledge, attitudes, and behaviors among the priority audience(s). Referring to the program’s logic model can help to identify key program areas that need to be included in monitoring indicators.

Indicators fall under the three stages of the logic model, which include:

  • Inputs – resources, contributions, and investments that go into a program
  • Outputs – activities, services, events and products that reach the priority audience(s)
  • Outcomes – results or changes for the priority audience(s)

Each stage of the logic model can use indicators to assess inputs, outputs, and outcomes. Process indicators consist of inputs as well as outputs and provide information about the scope and quality of activities implemented; these are considered monitoring indicators. Performance indicators include outcomes and are most commonly used to measure changes towards progress of results; these are considered evaluation indicators.

Step 2: Use the SMART Process to Develop High-Quality Indicators

One way to develop good indicators is to use the SMART criteria, as explained below. Consider each of these points when developing new indicators or revising old ones.

  • Specific: The indicator should accurately describe what is intended to be measured, and should not include multiple measurements in one indicator.
  • Measurable: Regardless of who uses the indicator, consistent results should be obtained and tracked under the same conditions.
  • Attainable: Collecting data for the indicator should be simple, straightforward, and cost-effective.
  • Relevant: The indicator should be closely connected with each respective input, output or outcome.
  • Time-bound: The indicator should include a specific time frame.
Implemented between 2008 and 2011 in Tanzania, the Fataki Campaign was designed to address the potential risk of HIV exposure in intergenerational relationships, through which older men offer young women financial or material goods in exchange for sex. This campaign included various mass-media and community-based activities. The monitoring and evaluation process for this campaign used multiple indicators to track the progress of the intervention, including ones used to track community discussions about Fatakis. One such indicator is used in the example below. Note how much the indicator improves through this SMART process.

The example below uses the SMART approach to improve an indicator related to family planning.

1. What is the input/output/outcome being measured?Outcome: An increase in interpersonal communication about cross-generational sex as a result of the Fataki campaign
2. What is the proposed indicator?Percent that have talked to someone about cross-generational sex.
3. Is this indicator specific?It describes what people are talking about but does not specify the audience to be measured or who they are talking to. The indicator should include the percent of what population have talked to who? about cross-generational sex.
4. Is this indicator measurable?Yes, but additional refinement would make it easier to replicate over time. Some participants may discuss cross-generational sex even if they were not exposed to the Fataki Campaign. A better way to assess this would be to change discussion about cross-generational sex to discussion about a “Fataki” message. Also, interpersonal communication implies a two-way discussion. Therefore, the indicator should include “discussed with” rather than “talked to.”
5. Is the indicator attainable?This indicator is attainable because data for this indicator will be collected through a question in a larger, project-funded survey.
6. Is the indicator relevant and related to the input/output/outcome being measured?This is directly related to the outcome as individuals who have talked to someone about cross-generational sex have likely participated either directly or indirectly in interpersonal communication about the campaign.
7. Is this indicator time-bound?This indicator is implicitly time-bound, but not explicitly. The word “ever” or “in the last three months” should be added to clarify the time frame.
8. Based on answers to the above questions, what is the revised proposed indicator?Percent of community members that have discussed a “Fataki” message in the last three months with another person in the community.

Step 3: Establish a Reference Point

To show change or progress in a program, a reference point must be established. A reference point is a point before, during, or at the end of a program where indicators are used to establish the state of the program in terms of the audience’s knowledge, attitudes or behavior in order to provide a point of comparison as the program progresses. The reference point is often chosen before or at the start of a program to assess the progress of the program over time. At the same time, implementation timelines do not always allow for baseline data to be collected. In these cases reference points can be set up at other times in the program.

Depending on the stage of the intervention, a reference group can be established in one of several ways (see Figure 1 in Step 5):

Intervention has not begunIntervention has begunIntervention is over
Establish the reference point immediately before it begins. This point is usually referred to as a baseline.See if any data related to the program indicators were collected in other surveys targeting similar populations. For example, use data from large-scale national surveys like DHS.A reference point can be established through a control group. Identify a sample group that has not been exposed to the intervention and is demographically, geographically, cuturally, and socially similar to the intervention group. Then administer data collection on program indicators with this group.
If comparable measurements in other surveys/programs cannot be found, use the program indicators to collect data on the current state of the program, even if it has already begun.

For example, the Fataki campaign described earlier chose to establish a reference point through a control group, which was then compared to those who were exposed to the Fataki campaign. This method is an acceptable way of evaluating a program, although it creates complications when used for ongoing monitoring.

Step 4: Set Targets

Targets define the path and end destination of what a program hopes to achieve and is a number or percentage which will measure success. Once the reference point is established, determine what changes should be seen in the program’s indicators that would reflect progress towards success.

When establishing targets, consider:

  • Baseline data or reference point: This sets a certain point in time in the program from which to observe change over time.
  • Stakeholder’s expectations: Understanding the expectations of key stakeholders and partners can help set reasonable expectations for what can be achieved.
  • Recent research findings: Do a literature search, if literature is available, for the latest findings about local conditions and the program sector, or conduct FGDs or IDIs in order to set realistic targets.
  • Accomplishments of similar programs: Identify relevant information on similar programs that have been implemented under comparable conditions. Those with a reputation for high performance can often provide critical input on setting targets.

The table below provides an example of how to visually organize inputs/outputs/outcomes, indicators, reference points and targets, using the same Fataki campaign described earlier. Making a table like the one below can provide a method for tracking the progress of the program and understanding how each indicator, reference point, and target fits with the logic model.

Input/Output/OutcomeIndicatorReference pointTarget
Output: An increase in interpersonal communication about cross-generational sex as a result of the Fataki campaign.Percent of community members that have ever discussed a “Fataki” message with another person in the community.Among those not exposed to the Fataki campaign, 0% have discussed a “Fataki” message with someone.Among those who have been exposed to the Fataki campaign, 65% have discussed a “Fataki” message with someone.

Step 5: Determine the Frequency of Data Collection

As a last step, consider how often data should be collected in order to properly track the program’s progress. These designated points in time are usually referred to as benchmarks. Ideally, at least one round of data collection should occur between the reference point and the end of the program. If the data are collected at the midpoint of the program, it is called a midline. If data are collected at the end of the program, it is called an endline (see Figure 1). In the Fataki example, only endline data was collected. The frequency of collecting data is mostly dependent on the cost and length of the program — longer programs, or those with more funding, can typically collect comprehensive data more frequently than shorter programs or those with less funding.

Figure 1

Conclusion

Proper indicators are crucial to any program as they provide data needed to track program progress. By closely tracking the progress of a program, any problems can be quickly identified and addressed. Being able to address problems in a timely manner can help improve programs and ensure better results. Better results allows for informed progress reports grounded in evidence, which help prove the effectiveness of a program to current and future funders.

In order to make the most out of indicators, they should be “SMART” (Specific, Measurable, Attainable, Relevant, and Time-Bound) and establish a point of reference, targets, and frequency of data collection for effective program monitoring and evaluation.

Templates

Developing Indicators: A SMART Criteria Checklist

Tips & Recommendations

  • Remember no indicator will meet all of the SMART criteria equally. Use discretion in determining what will provide a balance between validity and practicality.
  • Although the interests of stakeholders are critical to selecting proper indicators, this does not mean that indicators must be created to capture every stakeholder concern. The managers of the program must use their best judgment to include stakeholder interests where possible and appropriate.

Glossary & Concepts

  • Inputs include the resources, contributions, and investments that go into a program

  • Outputs are the activities, services, events and products that reach the program’s primary audience

  • Outcomes are the results or changes related to the program’s intervention that are experienced by the primary audience

  • Process indicators provide information about the scope and quality of activities implemented, and consist of inputs as well as outputs; these are considered monitoring indicators.

  • Performance indicators are most commonly used to measure changes towards progress of results, and include outcomes; these are considered evaluation indicators.

  • Reference point is a point before, during, or at the end of a program where indicators are used to establish program characteristics in order to provide a point of comparison as the program progresses.

  • Targets are pre-established goals that are set for the program.

  • Benchmarks are designated points in time in which data are collected to track the program’s progress

  • Midline refers to data collected at the mid point of a program

  • Endline refers to data collected at the end of a program

Resources and References

References

Global Fund. Monitoring and Evaluation Toolkit: HIV, Tuberculosis, Malaria, and Health and Community Systems Strengthening.

Institutionalizing Learning. Designing for Results: Integrating Monitoring and Evaluation in Conflict Transformation Programs.

UNAIDS. Monitoring and Evaluating Fundamentals. An Introduction to Indicators.

UNDP. Selecting Indicators for Impact Evaluation

Kusek, J.Z., & Rist, R.C. (2004). Ten Steps to a Results-Based Monitoring and Evaluation System: Planning for Improving – Selecting Results Targets.


Banner Photo: © 2007 Bonnie Gillespie, Courtesy of Photoshare