Introduction

Developed by Breakthrough RESEARCH, this guide will help managers support research, monitoring, and evaluation (RME) staff and ensure they have the programmatic data required to track results, and it will ensure the program is guided by robust theory-driven evidence with results tracked over time and at program completion. While the steps presented include examples specific to family planning (FP) programs, they can be used for any social and behavior change (SBC) program.

This guide is one of a series of how-to guides on the Compass for SBC that provide step-by-step instructions on how to perform core SBC tasks. From formative research through monitoring and evaluation (M&E), these guides cover each step of the SBC process, offer useful hints, and include important resources and references.

Why use behavioral theories when developing a theory of change to monitor and evaluate SBC programs?

Behavior change theory is used to explain people’s behaviors and the determinants that make it easier or harder to change those behaviors. Behavior change theory should be incorporated into the SBC program theory of change to illustrate how or why a desired change is expected to occur (i.e., the change pathways) and therefore provide guidance on how to measure behavioral determinants that influence program goals and objectives. For more on how to develop a theory of change, see the resources available from the Center for the Theory of Change.

The change pathways reflected in the theory of change should guide development of the M&E plan. An M&E plan for an SBC program outlines a) indicators to measure progress and results following the change pathways, b) methods for how they are going to be collected and monitored, and c) plans for how data will be analyzed and results will be communicated. An M&E plan for an SBC program helps ensure that data will be used efficiently to improve the program and report on results at various intervals.

Who should develop the theory of change for the SBC M&E plan?

The program staff involved in designing and implementing the program should develop the theory of change in collaboration with the RME staff. The RME staff should then use the theory of change to guide development of the SBC M&E plan in consultation with the program staff.

When should the plan be developed?

Ideally, an SBC M&E plan guided by the theory of change should be developed at the beginning of the SBC program, when the interventions are being designed. By instituting a system to monitor their program’s progress, programs can periodically reflect and make program adaptations informed by evidence. An SBC M&E plan also enables the program to evaluate success. When this is not possible, it is never too late to work with program staff to develop a theory of change and evaluation plan.

Who is this guide for?

This guide is designed for program managers and midlevel professionals who are not trained as researchers but need to understand the rationale for using a theory-based approach to designing programs and the measurement processes involved. The guide will help managers support RME staff and ensure they have programmatic data required to track results, and it will ensure the program is guided by robust theory-driven evidence with results tracked over time and at program completion. While the steps presented include examples specific to FP programs, they can be used for any SBC program.

Learning Objectives

  1. Understand the rationale for building a SBC program theory of change that incorporates behavior change theory.
  2. Identify the types of indicators that are useful to mea- sure in an SBC program through inclusion in an SBC M&E plan as described in “How To Develop a Monitor- ing and Evaluation Plan.”
  3. Learn how data can help explain whether the SBC program reached the desired outcome or, if not, why not.

Estimated Time Needed

Developing a program theory of change and selecting indicators for an SBC M&E plan can take up to a week, depending on the program’s size or scope, the availability of program and RME staff, and the extent to which staff have considered factors influencing priority behaviors.

Prerequisites

How To Develop a Monitoring and Evaluation Plan 

How to Develop a Logic Model

Steps

Step 1: Understand factors influencing priority behaviors targeted by the SBC program using behavioral theory

To develop an SBC M&E plan, program staff, with input from RME staff, must identify the priority behaviors and understand the underlying factors (e.g., financial or distance-related barriers) and/or behavioral determinants (e.g., attitudes and social norms) that the program is targeting to achieve desired change. Several resources are available to help identify priority behaviors, including Advancing Nutrition’s Prioritizing Multi-Sectoral Nutrition Behaviors, the THINK Behavior Integration Guide (BIG), and the Evidence-Based Process for Prioritizing Positive Behaviors for Promotion: Zika Prevention in Latin America and Caribbean and Applicability for Future Health Emergency Responses.

Behavior change theory provides a theoretical foundation for identifying behavioral determinants. There are behavior change theories that are focused on the individual level, such as Ajzen’s theory of planned behavior,1 and multilevel SBC theories, such as the socio-ecological model,2 that explain how behavioral determinants at multiple levels influence health behaviors.

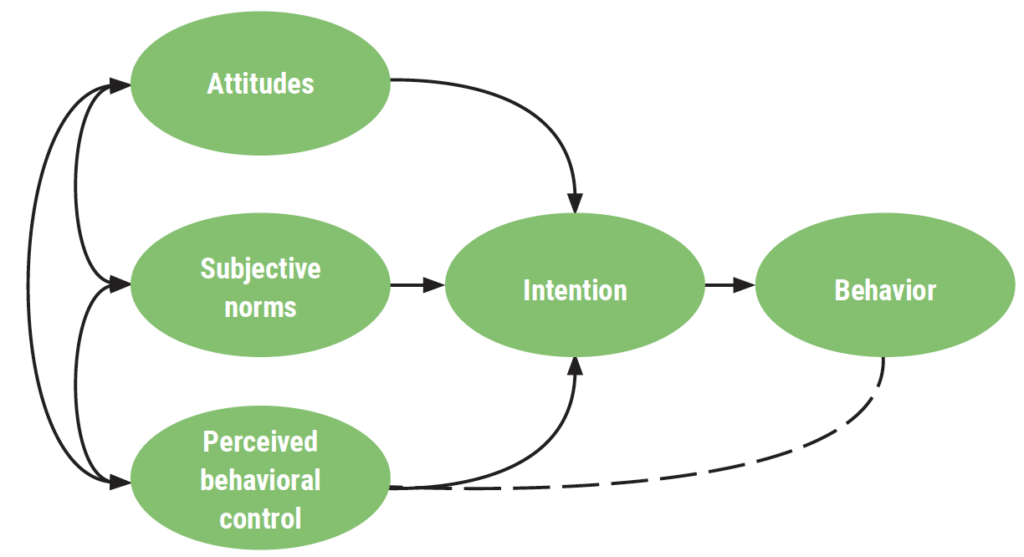
Figure 1 presents Ajzen’s theory of planned behavior, which describes how individuals are more likely to adopt a behavior if they have positive attitudes toward the behavior, believe that others in the community support the behavior (or subjective norms), and believe that they have control to adopt the behavior. These determinants influence an individual’s intention to adopt and his or her ultimate behavior adoption.
Ajzen’s Theory of Planned Behavior
Figure 1 Theory of Planned Behavior

Table 1 provides definitions and examples of the behavioral concepts described in the theory of planned behavior.

Behavioral DeterminantsDefinitionExample
AttitudeAn individual’s overall evaluation of the behaviorAgree it is acceptable for a couple to use methods such as condoms, the pill, or injectables to delay or avoid pregnancy
Subjective normA person’s belief about whether significant others think he/she should engage in the behaviorMembers of this community would agree if a woman uses contraception
Perceived behavioral controlA person’s expectation that performance of the behavior is within his/her controlAgree could use family planning even if his/her partner objected
IntentionA person’s motivation to engage in a behaviorIntent to use a modern contraceptive method
BehaviorHow a person acts or conducts him/herselfCurrently using a modern contraceptive method

Table 1 Behavioral Determinants Definitions and Examples

Figure 2 presents the socio-ecological model. In this model, behavior change is considered in the context of multiple levels, including the individual level; interpersonal level, or relationships with partners, families, and friends; organizational level; community level; and the enabling environment.
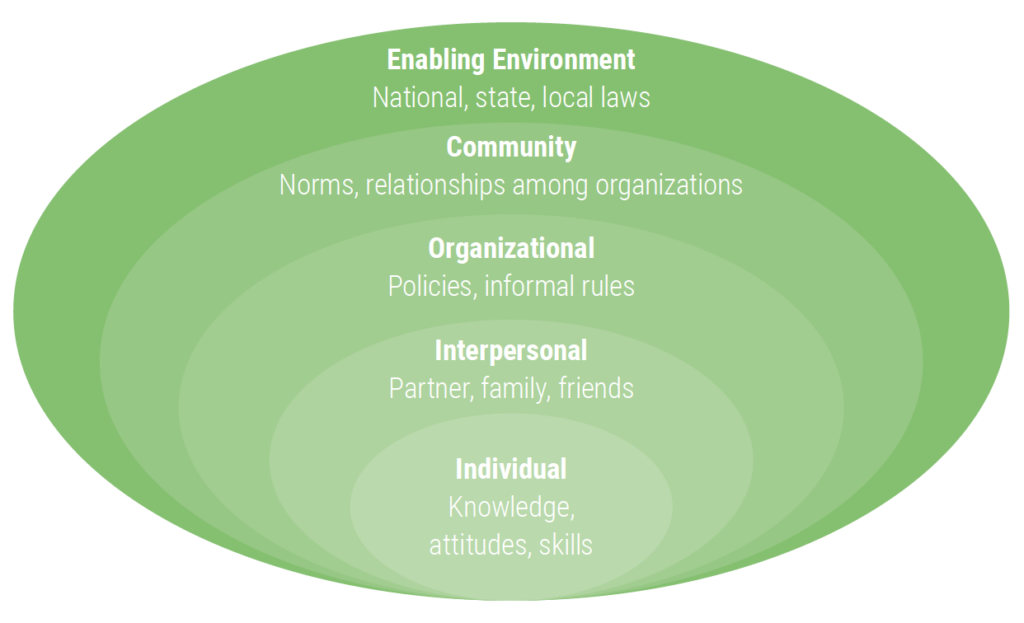
Figure 2 Socio-ecological Framework for SBC Model
Source: Adapted from McLeroy et al. 1988

Program designers may draw from these behavior change theories and/or others to guide development of their program and theory of change. This summary from the World Bank provides an introduction to additional behavior change theories that are commonly used by health programs. Selection of the most appropriate theory is situation-specific and depends on the audience, setting, and behavioral determinants that need to be addressed.

Activities that influence the factors preventing or supporting behavior change

Once the program team identifies the behavioral determinants from behavioral theory that either prevent or support behavior change, they can identify the activities that will influence these behavioral determinants. The list of activities can then be organized in a logical framework, also called a logframe. A logframe is a planning tool that consists of a matrix showing a project’s goal, activities, and anticipated results. The structure helps program designers specify the components of a project and its activities and how they relate to one another. See How to Develop a Logic Model.

Step 2: Build a program theory of change

A program theory of change explains the behavioral determinants that prevent or facilitate behavior change that the program must address to achieve its desired outcomes. Behavior change theories can help to map out the “missing middle,” or the change that program activities bring about in pursuit of its goals.

The program team can develop a common understanding of activities that influence the behavioral determinants preventing or supporting behavior change that can be pursued to bring about desired change in specific behaviors.

Identifying the behavioral determinants also highlights opportunities for measurement in the SBC M&E plan. Thus, the program team can focus not only on the ultimate adoption of a behavior but also consider revising the intermediate outcomes referenced in the theory of change if improvements in behaviors are not seen during or at the end of the project.

What does a theory of change look like? In the example in Figure 3, the Merci Mon Héros campaign, a youth-led multimedia campaign in francophone Africa, the program’s theory of change incorporates aspects of a behavior change theory called the Theory of Planned Behavior. As described in Step 1, the theory of planned behavior suggests individuals are more likely to adopt a behavior if they have positive attitudes toward the behavior, believe that others support the behavior, and believe that they have self-efficacy to adopt this behavior.
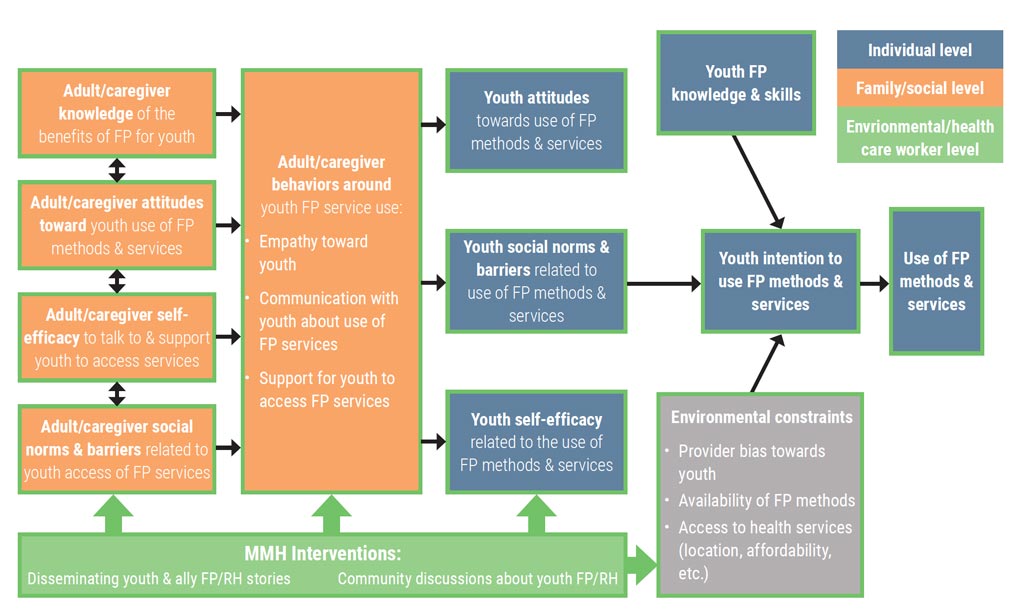
Figure 3 Merci Mon Heros Program Theory of Change
Figure 3 Merci Mon Héros Program Theory of Change
Source: https://ccp.jhu.edu/2020/03/30/youth-reproductive-health-heroes-francophone

These behavioral determinants then influence an individual’s intention to adopt and his or her ultimate behavior adoption. These behavioral determinants are further described in Table 2. The SBC activities in this campaign focus on strengthening communication between youth and supportive adults to improve knowledge and bring about changes in intermediate outcomes, such as youths’ attitudes, self-efficacy, social norms, FP knowledge and skills, and intention to use FP services.

BehaviorKnowledgeAttitudeSelf-efficacyIntentNorms
Parent/adult ally speaks to youth about FP/reproductive health (RH)Parent/adult ally recognizes that youth are/can be sexually activeParents/adult allies accepts/tolerates that youth are sexually activeParent/adult ally believes other parents accept that youth are/may be sexually active
Parent/adult ally knows to talk to youth about FP/RHParents/adult allies believes they should speak to youth about FP/RHParent/adult ally believes they can speak to youth about FP/RHParents/adult allies intend to talk to youth about FP/RHParent/adult ally believes other parents in the community speak to youth about FP/RH
Parent/adult ally knows that youth need guidanceParents/adult allies approve of youth using FPParent/adult ally believes they can speak to youth about FPParent/adult ally believes other parents in the community approve of youth using FP
Parent/adult ally knows that FP can help youth achieve life goalsParents/adult allies have a favorable attitude toward young people’s use of FP to help them achieve life goals
Youth speak to adults about
FP/RH
Youth know that there are adults they can trust to talk about FP/RHYouth believe they should speak with adults about FP/RHYouth believe they can speak to adults about FP/RHYouth intend to speak to adults about FP/RHYouth believe that other youth speak to adults about FP/RH
Youth use FP if sexually activeYouth know about the FP methodsYouth believe they should use FP if sexually activeYouth believe they can use FP if sexually activeYouth intend to use FP if sexually activeYouth believe that other youth use FP if sexually active

Table 2 Intended Outcomes and Hypothesized Behavioral Pathways

Step 3: Select meaningful SBC indicators

RME staff should collaborate closely with program managers and technical experts to gain a solid understanding of the program’s planned activities before selecting indicators and developing an M&E plan for the SBC program. The monitoring plan should be linked to the theory of change that guides program activities.

SBC-related indicators measure processes and approaches implemented to support the intended audiences to adopt and maintain the recommended behaviors, as outlined in the theory of change.

M&E plans for SBC programs should measure the following:

  • Number or percentage of beneficiaries exposed to an intervention
  • Factors to be influenced by the planned intervention/activities, such as attitudes, self-efficacy, and subjective norms. 
  • Desired effect on the audience’s behavior

Details on how to measure SBC indicators, including detailed indicator reference sheets, are available to support RME staff in the programmatic research brief Twelve Recommended SBC indicators for Family Planning programs. Several of the indicators detailed in the programmatic research brief can be applied to the stages of the Circle of Care, as illustrated in Figure 4.
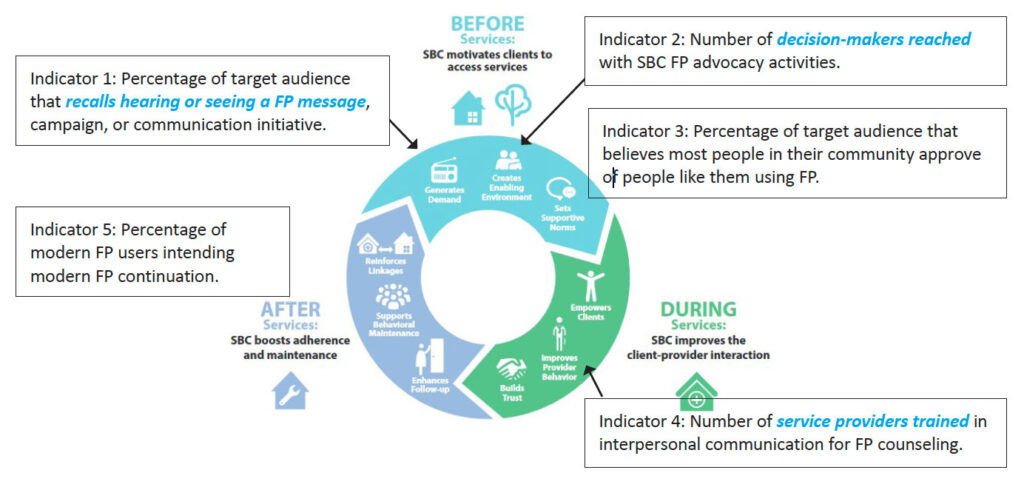
Figure 4 Indicators Linked to The Circle of Care Model
Source: Carlsson, O. & Heather, H. 2020. From vision to action: Guidance for implementing the Circle of Care Model. Breakthrough ACTION, Johns Hopkins Center for Communication Programs

In the Before Services stage, a program may create an enabling environment by engaging with decision-makers to gain their support for FP. FP programs also often address social norms. These can be measured by:

  • Indicator: Number of decision-makers reached with SBC FP advocacy
  • Indicator: Percentage of target audience that believes most people in their community approve of people like them using FP

In the During Services stage, provider behavior is important, and interventions can be used to address client-provider interactions. These can be measured by:

  • Indicator: Number of service providers trained in interpersonal communication for FP counseling
  • Indicator: Percentage of women who are satisfied with the quality of FP services provided as measured through a client satisfaction score 

In the After Services stage, SBC can ensure that people continue to use a contraceptive method. This can be measured by:

  • Indicator: Percentage of modern contraceptive users intending to continue using a modern FP method

SBC outcomes must be measured to determine whether the behavior has changed as intended. A number of potential SBC indicators are available in the SBC Indicator Bank for Family Planning and Service Delivery (Figure 5). Some examples include:

  • Indicator: Percentage of nonusers (among intended audience) who intend to adopt FP in the next 3 months
  • Indicator: Number/percentage of women who deliver in a facility and initiate or leave with a modern contraceptive method prior to discharge 
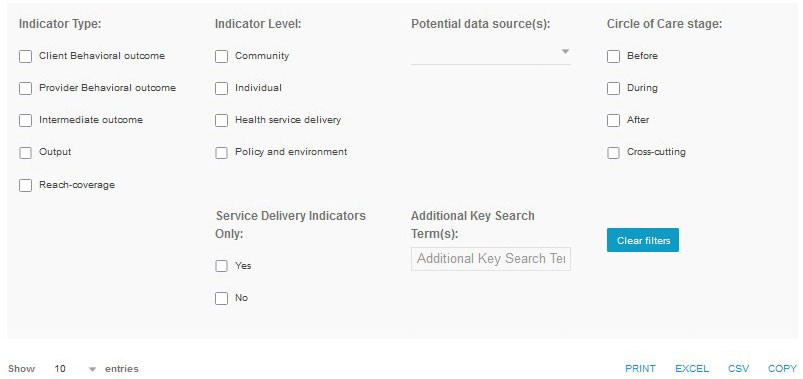
Figure 5 SBC Indicator Bank for Family Planning and Service Delivery
Source: https://breakthroughactionandresearch.org/social-and-behavior-change-indicator-bank-for-family-planning-and-service-delivery/

This FP indicator bank contains sample indicators for monitoring and evaluating SBC programs. The bank includes a subset of SBC indicators specifically for service delivery.

The data for SBC-related indicators can come from a routine monitoring system that captures outputs such as number of providers trained in high-quality counseling or number of community-level activities for FP conducted in project sites, or they may come from household surveys and qualitative interviews with program participants. 

Step 4: Monitor SBC implementation

Measurement is essential to strengthen SBC programmatic focus and determine effectiveness and impact.

Program managers and staff should not wait until the end of a project to find out whether project activities are achieving intended results. When the project is under way, they should start to ask some important questions, including: 

  • Throughout implementation, are activities adhering to the project design guided by the SBC theory of change? How has the program contributed to an observed intermediate outcome along the theory of change pathways?
  • How have contextual factors influenced the intervention?

To answer these questions, RME staff should examine the program’s routine monitoring systems. These would contain the output indicators that capture the project’s completed activities. RME staff can also use targeted qualitative studies to explore how the program is contributing to outcomes along the pathways in the theory of change.

Routine Monitoring

Routine monitoring can uncover gaps between the target and actual number of planned activities. For example, the project may have planned to conduct community meetings to share information with community members. 

In Figure 6, the example project met its targets in quarter 4 (Q4) of 2013 and Q1 of 2014 but missed its targets in Q2 and Q3. In the last quarter of 2014, nothing happened, and it will be important to ask why.

It may also be useful to track additional information related to the meetings, such as the number of participants disaggregated by sex or age, to understand who attended the meetings and whether there are any target audiences not being reached.
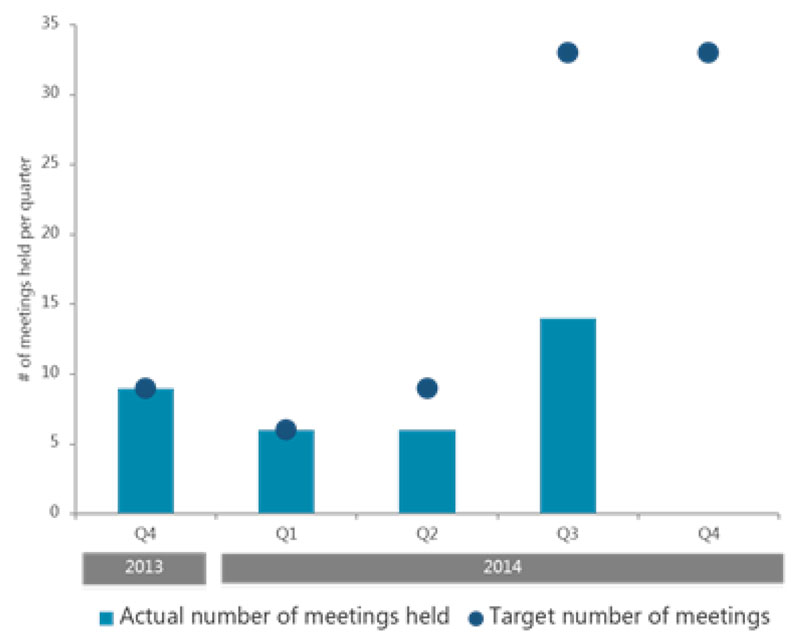
Figure 6 How Well Did the Planned Activities Adhere to the Original Design of the Project During Implementation?
Source: Dougherty, L. et al.2018. “A mixed-methods evaluation of a community-based behavior change program to improve maternal health outcomes in the upper west region of Ghana,” J Health Commun. 23: 80–90.

Routine monitoring should also track intermediate outcomes related to behavioral determinants so that if improvements are not observed, midcourse corrections can be made. An example of how behavioral determinants can be monitored throughout a program is illustrated through the Confiance Totale campaign. 

The Confiance Totale campaign promotes safe and effective FP within a supportive social context in Côte d’Ivoire with the objective of increasing demand for FP services. Breakthrough RESEARCH conducted a monitoring study using interviewer-administered computer-assisted telephone surveys to determine 1) the level of unprompted recall of the Confiance Totale campaign among target beneficiaries and 2) if recall of the campaign was associated with higher levels of perceptions of FP safety, FP-related social norms, self-efficacy, spousal communication about FP, intention to talk to a partner about FP, intention to seek FP information at a health facility, intention to use FP, and current use of FP methods.

Table 3 shows the behavioral determinants measured during the Confiance Totale campaign in Côte d’Ivoire. As shown in the table, we see that among males’ relationship status (being married or living as married) arises as a significant factor associated with descriptive social norms around FP communication and use in their community. This may indicate that males are most attuned to FP-related social norms when they enter long-term relationships, regardless of age. Findings from the monitoring study recommended the campaign purposefully target unmarried men to highlight the relevance and importance of FP use and promote FP as a concern for both sexes in nonpermanent relationships. 

Factors associated with the likelihood of believing that others talk about FP—male responses: 

Odds Ratio95% CI
Frequency of CT radio spot recall
At least once a day1.35.80–2.28
At least once a week1.48.88–2.47
Less frequently1.46.59–3.61
Not at all
Time (data collection week)1.09*1.01–1.17
Current use of FP1.87***1.39–2.51
Talked to a health provider about FP in last month1.07.67–1.71
Talked to partner about FP in last month2.53***1.91–3.36
Age group
18–24
25–341.44.93–2.23
35+1.26.75–2.14
Married or living with someone as married1.76***1.27–2.44
Number of children
0 child
1–2 children.75.53–1.05
3+ children.85.53–1.35
Level of education
None.75.30–1.82
Incomplete primary.73.38–1.40
Complete primary
Incomplete secondary1.04.65–1.66
Complete Secondary1.18.72–1.96
University.69.43–1.12

Table 3 Did the Confiance Totale Campaign Address Social and Gender Norms Related to Using Family Planning?

*p<.05; **p<.01; ***p<.001
Source: Silva, M., K. Edan, and L. Dougherty. 2021. “Monitoring the quality branding campaign Confiance Totale in Côte d’Ivoire,” Breakthrough RESEARCH Technical Report. Washington DC: Population Council.

Qualitative research

Qualitative methods such as focus group discussions and in-depth interviews can be valuable tools to explore how and why program activities are working (or not). Researchers can conduct focus group discussions and in-depth interviews with project staff, government stakeholders, and program participants to understand the factors influencing the project’s ability to adhere to its planned activities and how the program is addressing behavioral determinants such as attitudes and social norms. 

For example, qualitative findings exploring how the Merci Mon Héros campaign contributed to changes in communication between parents or adult allies and youth about intimate relationships and FP and RH found that among adolescents, the campaign raised their perception of the importance of communication with adults/parents on sexuality issues. The campaign also encouraged some to initiate conversations with their peers and their parents on these topics. Despite the support and enthusiasm of some participants for communicating more with youth or adults, the study also noted a continued reluctance on the part of many to talk about sexuality, with overarching social norms still acting as barriers to communication. Some adults noted they knew they needed to communicate about FP/RH with their youth but did not do so simply because they did not know how and when to talk about it. Youth indicated that it was easier for adults to talk to young people than it is for young people to talk to adults, as talking about sexuality and FP/RH still has negative connotations. These findings provided valuable information related to the theory of change pathways outlined in Figure 3 and helped to provide guidance on how the Merci Mon Héros campaign should adapt to address the challenges described by program participants.

Step 5: Evaluate SBC implementation effectiveness and impact

Measurement is essential to strengthen the programmatic focus of SBC and determine program effectiveness and impact.

Program managers and staff want to know if they reached the desired outcome identified in the theory of change. Some questions to ask include:

  • To what extent did the project (or program) document changes in the behavioral determinants that the intervention targeted?
  • To what extent did the project achieve the desired behavior change?
  • Was the project cost-effective?

To measure whether a project achieved the desired behavior change quantitatively, managers and staff would need to use routine program and monitoring data or conduct a survey to assess change. Ideally, this survey would measure the behavior before the intervention to establish a baseline value and include a comparison group that is not exposed to the intervention to measure change over time and to ensure that the change occurred because of the intervention. In one example, a mass media campaign in Burkina Faso, the primary outcome of a randomized controlled trial was modern contraceptive use at the time of the survey. Following a 2.5-year campaign, there was a 5.9 percentage point increase in modern contraceptive use in the intervention zones compared to the control zones. Figure 7 illustrates these results. For additional details on impact evaluation designs, please refer to the United States Agency for International Development’s (USAID’s) Introduction to Impact Evaluation Designs.

Following a 2.5 year mass media campaign, the percent of women who were using or whose partners were using modern contraception increased by 11.4% in the intervention area, compared to just 6.5% in the comparison area.
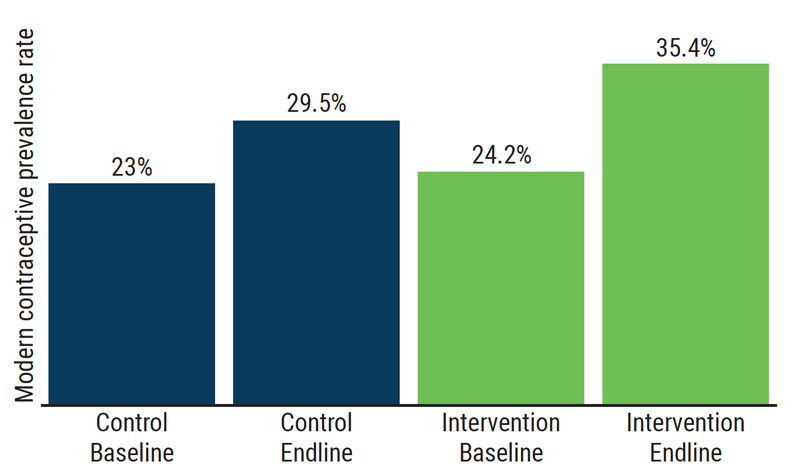
Figure 7 Did the Project Increase Modern Contraceptive Use?
Figure 7 Did the Project Increase Modern Contraceptive Use
Source: Glennerster, Rachel, Joanna Murray, and Victor Pouliquen. March 2021. “The media or the message? Experimental evidence on mass media and modern contraception uptake in Burkina Faso” CSAE Working Paper WPS 2021-04. https://www.developmentmedia.net/project/familyplanningrct/#project-impact

Step 6: Communicate findings

A final critical step is ensuring that program results are shared with others who can use the information in their work in formats that are accessible, appropriate, and tailored to the intended audience. Here are a few ways in which findings can be applied to improve programs and disseminated more broadly to key audiences who can take up the findings in their efforts:

  • Organize in-depth technical workshops with program team members to discuss emerging findings.
  • Discuss evaluation findings with the program’s beneficiaries, seeking their feedback on the validity and accuracy of the findings.
  • Provide donors and policymakers with evidence on what works for addressing a given problem, where key gaps exist, and what actions they should consider addressing.
  • Publish research results in peer-reviewed journals to reach researchers and technical experts.
  • Share through online platforms such as the Compass for SBC and Knowledge SUCCESS to reach program implementers as well as communities of practice (e.g., SBC for service delivery community of practice group).
  • Develop policy briefs and fact sheets to reach advocacy organizations and policymakers.

Conclusions and Recommendations

This guide describes how to use a theory of change-based approach to design programs and the measurement processes involved. The guide should be used with the How To Develop a Monitoring and Evaluation Plan.

To effectively integrate a theory of change into an M&E plan, SBC programs should:

  • Use a theory of change process at the design stage and identify the important behavioral determinants that can be addressed with SBC programs.
  • When selecting indicators for SBC M&E plans, consider measures that assess exposure to the program and determinants of behavior
  • Introduce qualitative studies such as in-depth interviews or focus group discussions throughout implementation to complement routine monitoring and help explain how the program is working. 
  • Share evidence on what works and how interventions can be improved to advance the FP and SBC fields and achieve greater programmatic impact. 

Glossary and Concepts

SBC is a systematic, evidence-driven approach to improve and sustain changes in behaviors, norms, and the enabling environment. SBC interventions aim to affect key behaviors and social norms by addressing their individual, social, and structural determinants (factors). SBC is grounded in several disciplines, including systems thinking, strategic communication, marketing, psychology, anthropology, and behavioral economics. The role of human behavior is fundamental to the success of all development programs; thus, SBC is central to achieving many of USAID’s program outcomes.

Behavioral determinants include three categories: cognitive, emotional, and social. 

  • Cognitive factors address an individual’s beliefs, values, and attitudes (such as risk perceptions) as well as how an individual perceives what others think should be done (subjective norms), what the individual thinks others are actually doing (social norms), and how the individual thinks about him/herself (self-image).
  • Emotional factors include how an individual feels about the new behavior (positive or negative) as well as how confident a person feels that they can perform the behavior (self-efficacy). 
  • Social factors consist of interpersonal interactions (such as support or pressure from friends) that convince someone to behave in a certain way as well as the effect on an individual’s behavior from trying to persuade others to adopt the behavior as well (personal advocacy)

Source: Ideation an HC3 Research Primer

Factors affecting health behaviors:

  • Demand factors are the political, socioeconomic, cultural, and individual factors, such as geographic and financial barriers, that influence demand.
  • Supply environment factors includes things such as personnel, facilities and space, equipment, and supplies. They also include planning and implementation of the main program functions: management; training; distribution of supplies; information, education, and communication efforts; and research and evaluation.

Process indicators track how the implementation of the program is progressing. They help to answer the question “Are activities being implemented as planned?”

Outcome indicators track how successful program activities have been at achieving program goals. They help to answer the question “Have program activities made a difference?”

Source: https://www.measureevaluation.org/resources/publications/ms-96-03/at_download/document

Resources and References

Resources

Monitoring and evaluation resources

SBC monitoring and evaluation resources

References

1Ajzen, I. 1991. “The theory of planned behavior,” Organ Behav Hum Decis Process 50(2): 179–211.

2McLeroy, K. R., D. Bibeau, A. Steckler, & K. Glanz. 1988. “An ecological perspective on health promotion programs,” Health Education & Behavior 15(4): 351–377.

Acknowledgments

We’d like to thank Laura Reichenbach and Amanda Kalamar of the Population Council for their technical guidance and review; Sherry Hutchinson of the Population Council for design support; Chris Wharton (consultant) for editing; and Kristina Granger, Joan Kraft, Angie Brasington, and Lindsay Swisher of USAID, who provided valuable feedback during the development of this brief. 

Suggested Citation

Breakthrough RESEARCH. 2022. “How to use a theory of change to monitor and evaluate social and behavior change programs,” Breakthrough RESEARCH How-to Guide. Washington, DC: Population Council.

Cover photo credit: ©Dominic Chavez/The Global Financing Facility (Cropped, CC BY-NC-ND 2.0). This photo was taken prior to the COVID-19 pandemic.

©2022 The Population Council. All rights reserved.

Introduction

Audience segmentation is a key activity within an audience analysis. It is the process of dividing a large audience into smaller groups of people – or segments – who have similar needs, values or characteristics. Segmentation recognizes that different groups will respond differently to social and behavior change communication (SBCC) messages and interventions.

Why Segment an Audience?

Segmenting audiences enables a program to focus on those audience members who are most critical to reach and also to design the most effective and efficient strategy for helping each audience adopt new behaviors. Audience segmentation enables programs to match audiences, messages, media, products and services based on the specific needs and preferences of the audience. Tailoring an SBCC strategy to the characteristics, needs and values of important audience segments improves the chances for desired behavior change.

Who Should Conduct an Audience Segmentation?

A small, focused team should conduct the audience segmentation. Members should include communication staff, health/social service staff and, when available, research staff. Typically, the same team conducting the audience analysis will also conduct the audience segmentation.

When Should an Audience Segmentation Take Place?

Audience segmentation takes place during audience analysis. To gain stakeholder input, the audience segmentation can also be part of the stakeholders’ workshop.

Estimated Time Needed

Within audience analysis, audience segmentation can be completed in a few hours.

Learning Objectives

After completing the activities in the audience segmentation guide, the team will:

  • Define the audience segments for a particular health issue.
  • Select an appropriate audience segment for the intervention.

Prerequisites

Steps

Step 1: Review Audience Information

Review the information collected on the primary audience(s) during the situation analysis and audience analysis. This information will help the team understand whether and how best to segment the audience(s). The team should review:

  • How each audience is affected by the problem
  • Demographics
  • Size (number of people in the audience)
  • Knowledge and behaviors
  • Psychographics
  • Other information as appropriate.

Step 2: Decide Whether to Segment

Based on the audience(s) identified and their characteristics, first determine whether segmentation is necessary. Segmentation is recommended if:

  • The audience cannot be reached effectively with the same messages, interventions and channels. The audience (i.e. sexually active youth) may require different messages, interventions, or channels if:
  1. Certain segments are more heavily impacted by the problem (e.g. orphan girls are more likely to contract HIV)
  2. Certain segments have significantly different worldviews, needs or concerns (e.g. sexually active, urban boys view sex as a power symbol while sexually active young girls view sex as a means to receiving gifts)
  3. Certain segments are more difficult to reach (e.g. homeless sexually active youth do not have access to TV and need to be reached through community workers)
  • The program has a budget that allows for multiple approaches. Segmentation requires extra effort and resources (e.g. time to properly segment audiences, funds and staff time to design separate messages and materials, funds to use additional channels). If the budget does not allow for multiple approaches, identify the most important audience segment to reach and focus on that segment.

Step 3: Determine Segmentation Criteria

If it makes sense to segment, then the team needs to decide what criteria to use to segment the audience(s). First, look at the primary audience(s) and identify traits that make a subgroup significantly different from other audience members. A significant difference is one that requires a different messages or approach. These differences are typically based on socio-demographic, geographic, behavioral or psychographic differences among members of the primary audience.

Step 4: Segment Audiences

Segment the audience by using the criteria identified in Step 3. There are various methods teams can use to segment audiences.

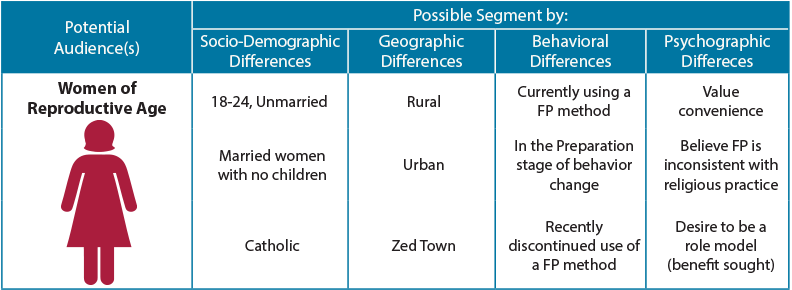
One option is to use a segmentation table. In Column 1, list the primary audience(s) chosen during the audience analysis. For each audience, identify potential segments based on the criteria from Step 3.

Adapted from A Field Guide to Designing a Health Communication Strategy

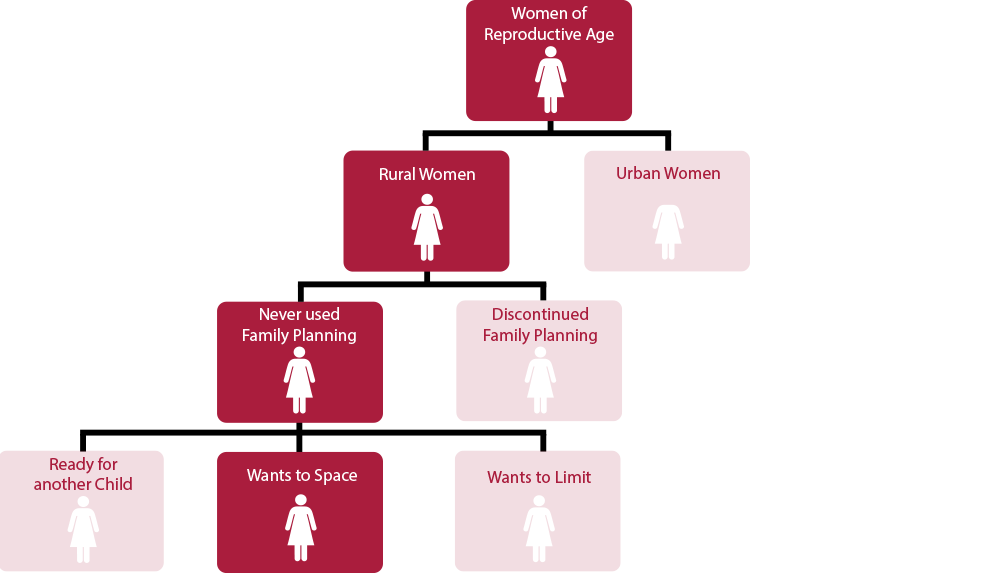
Another option is to create a segmentation tree, starting with a potential audience and dividing it by differences thought to be important. Stop when the need or ability to target differences ends. The example below presents one line of a segmentation tree for women of reproductive age.

A complete segmentation table or tree highlights potential audience segments. In the examples above, many segments are identified, including: current FP users, urban dwellers, women who value convenience, and women who want to space children. The program team now needs to determine which segments it should prioritize.

Step 5: Decide which Segments to Target

Deciding which segments to target and how to approach them is critical. If the program team identified more audience segments than it can or needs to reach, narrow the list. Here are some suggestions on how to narrow the list:

  • Impact: Look at the size of the segment and ask whether behavior change in this segment will have a significant impact on the problem. For example, will focusing on women with no children significantly increase contraceptive use and decrease maternal mortality? Are there enough women without children to make a difference?
  • Accessibility: Determine whether the program team is able to reach the particular segment with the resources available. For example, does the program team have connections with the rural audience? Can it work with rural leaders to ensure its message is delivered?
  • Program priorities: Programs often need to show impact early and quickly. In such cases, it may be necessary to choose audience segments whose behavior will be relatively easy to change. For example, the team may need to focus first on those who are already thinking about making a change (in the Preparation stage of behavior change) and then focus on harder-to-reach segments—requiring more time and effort—later in the program.

Using the suggestions above, finalize which segments the program will target. The number of segments will be based largely on the resources available and program goals.

Step 6: Assess the Proposed Segments

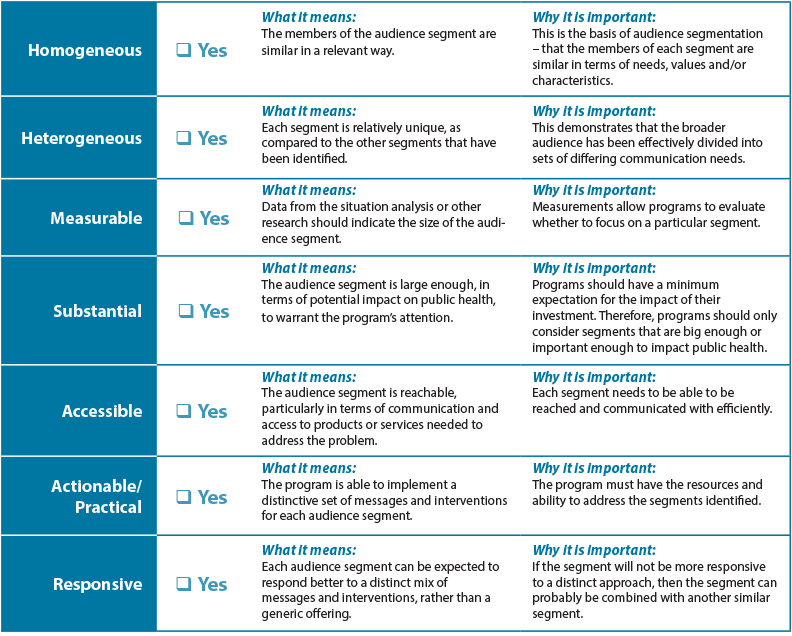
Once segments have been selected, ensure they are valid and usable. Use a checklist to ensure each segment meets the criteria for effective segmentation (see Audience Segmentation Checklist in templates). If a defined segment does not meet the criteria, it is best to drop it and consider other segments.

Adapted from Criteria for Market Segmentation

Step 7: Develop Audience Profiles

The audience analysis guide outlines how to develop audience profiles. Profiles might need to be refined or added based on further audience segmentation. Write the creative brief with the profile for each segment in mind.

Templates

Audience Segmentation Checklist

Tips & Recommendations

  • Ensure the program has resources to address multiple segments before engaging in the process of segmentation.
  • Look for ways to leverage funds with other programs so that additional segments can be reached with tailored messages and interventions.

Lessons Learned

  • Ensure that the segments chosen are different enough to warrant different messages and interventions.

Resources and References

Resources

A Field Guide to Designing a Health Communication Strategy

Segmenting the Market to Reach the Targeted Population

Market Segmentation Study Guide

Audience Segmentation Guide

References


Banner Photo: © 2014 Basil Safi, Courtesy of Photoshare

Introduction

__________________________________________________________

Click here to access this Guide in Arabicمراجعة هذا الدليل باللغة العربية، انقر هنا

Click here to access this Guide in Portuguese – Guias em Português

__________________________________________________________

Materials are a primary means by which health programs deliver social and behavior change communication (SBCC) messages. There are many types of SBCC materials, including printed brochures, the script for a television advertisement, a guide for facilitating a group discussion, a Facebook page or an Internet-based game. Materials development brings together the most effective messages with materials for the best combination of channels – the channel mix – in order to reach and influence the priority audiences.

Each type of material follows a slightly different process for development. Once materials are developed in draft form, they are then pretested, finalized, produced and disseminated as part of the SBCC campaign. This guide provides general steps for developing materials and draws on results from the message design and channel mix guides. In-depth guidance for specific types of materials can be found in the Resources section.

There are many ways to categorize communication materials and creative outputs, and the growth of electronic media means there is more overlap among the categories than ever. For example, brochures, music, movies and discussions can all be accessed digitally, and various materials can be used in interpersonal communication. What’s important is to identify the mix of materials, media and formats that will best influence the priority audience. This table provides several types of material to consider.
Channel/MediumTypes of Materials and Formats
Interpersonal Communication (IPC)Community dialogue manual/guide, IPC script/algorithm and flipcharts (peer-to-peer, health provider-client), inter-spousal and parent-child communication materials
Community/Folk MediaCommunity drama, interactive storytelling, music, community event, group discussion, mobile video unit/presentation, talk, workshop, door-to-door visits, demonstration, community radio – and the materials used, such as scripts, stories, lyrics, agendas, discussion guides and slide shows
Mass Media and Mid-MediaRadio/TV, such as an advertisement, PSA, drama, talk show, call-in program, contest or “reality” show; print, such as a brochure, flyer, booklet, health card/record, flipchart, poster, billboard, mural, newspaper/magazine article, newsletter, sticker, button or product label; film, such as a movie or b-roll; outdoor, such as posters and billboards
Digital and Social MediaWebsite, Facebook page, blog, video, song, game (including virtual reality), chat room, SMS, MMS, voice messages, voice information trees, survey, post, tweet, eToolkit, eForum, eZine article
Why Develop Materials?

Programs use creative outputs—materials—to communicate with audiences and influence behavior change. Well-designed materials with tailored messages have the potential to impact social norms and behaviors that lead to a healthier society. Following a structured process for materials design helps ensure that program outputs are audience-focused and compelling, which ultimately increases their effectiveness.

Who Should Develop Materials?

A small team of SBCC professionals and program staff typically work with one or more creative and technical professionals. Depending on the media and materials chosen, these professionals may include an artist, scriptwriter, design firm, advertising/public relations agency, media production company, digital media designers or others, as appropriate. SBCC materials can be developed within or outside a materials development workshop. Programs might opt to address message design, channel planning and other aspects of SBCC programming in a single workshop.

When Should SBCC Materials Be Developed?

Develop materials after designing messages and determining the channel mix.

Estimated Time Needed

Developing materials can take any period of time, from one week to a few months. Consider the size and efficiency of the creative team available to develop materials, how many materials need to be developed and the complexity of the topic. Generally speaking, longer and more complex materials take longer to develop than short, simple materials.

If working with an advertising or creative agency, request bids from at least three and ask that proposals include timelines, in addition to the specific steps, approvals, products and budget.

Learning Objectives

After completing the activities in the materials development guide, the team will know how to:

  • Match message and medium.
  • Select and develop content.

Prerequisites

Steps

Step 1: Review Existing Materials

Before engaging creative professionals and others in the materials development process, collect and review existing materials on the topic and related topics, as well as those created for the primary audience. If possible, obtain information, such as evaluation results, on how audiences responded to those materials and any impact the materials had. To locate existing materials, the team can scan the Internet using web search engines, and visit specific organization websites or SBCC resource sites [including Springboard, Health COMpass, Knowledge SUCCESS, Comminit, Communication for Development and others]. The team can also reach out directly to partner organizations and SBCC technical working groups.

Identify which materials can be used without making any changes, which can be adapted, what is missing and the mistakes to avoid. Consult the adaptation guide for assistance with adapting existing materials.

Step 2: Decide on the Materials to Develop

Refer to the program/campaign channel mix plan that outlines the preferred channels and types of materials based on audience preferences, cost and reach considerations, and the advantages and disadvantages of each channel (see channel mix guide for guidelines on creating a channel plan). Use this information and the messages developed in the message design guide to decide which messages will be presented in which media via which materials for which audiences. Base these decisions on considerations, such as:

  • The message to be conveyed. For example, complex or controversial messages require longer and/or more interactive formats (radio/TV programs with call-in segments, structured IPC activities) than simple messages do.
  • The barrier being addressed. For example, addressing self-efficacy barriers is best done through formats that allow participants to practice new skills.
  • The channel selected. For example, which messages can be effectively conveyed in a community drama attended by people of all ages and genders?
  • Frequency with which the message should be seen. For example, it will be helpful to convey simple messages that benefit from a lot of repetition on billboards, posters, radio spots and household items.

For this step, complete a table to align audiences, messages, channels and materials. This will help the team determine what materials should be developed.

AudienceMessages to ConveyChannelType of Material
  • Women
  • Ages, 15-45
  • Low income
  • Low to medium education
  • Urban
  • Married

Planning your family can help you and your family members achieve a brighter future.

Make Family Planning a regular part of your life.

Family Planning is good, effective, safe, and acceptable.

Print

Outdoor Media

Radio

Brochure

Billboard

45-second PSA

  • Male partners of the women
  • Ages, 20-50
  • Low income
  • Low to medium education
  • Urban

Planning your family can help you and your family members achieve a brighter future.

Helps the family manage its available resources so the children can grow healthy and be well-educated.

Helps the father, mother and child to stay healthy.

Radio

Outdoor Media

30-second PSA

Billboard

Step 3: Complete Materials Development Worksheets

For each material identified in step 2, complete a materials development worksheet (see Template 1: Materials Development Worksheet). Transfer key messages developed during the message design phase to the first column of the materials development worksheet. Note that the message is not necessarily the words that will be used in the material, but the main idea that will be conveyed. Messages may be communicated in many ways in a material, including through the text/words, audio, images (pictures, graphics, video), tone and/or action. For each message, add proposed content to the table. Use the completed worksheet to create the draft material (Step 6).

  • Image: Briefly describe the image that will support the message. This might be a drawing, photo or other graphic.
  • Text/Words: Be concise. Use vocabulary, expressions and grammar appropriate for the audience and acceptable to gatekeepers. For non-medical, non-technical audiences, avoid medical and technical language. Consider whether to include text in print materials for low-literate or non-literate audiences. (Literate persons in the household could use the text to help explain or remind the intended audience member.)
  • Actions: Describe the actions that should be shown in the visual, heard in the audio or serve as instructions for artists/directors/producers.

Working with a professional creative agency can be especially helpful during this stage, due to their experience and creative insights.

Materials Development Worksheet: Oral Rehydration Solution (ORS) TV Spot

MessageContent
ImageText/Audio/DialogueAction
Prepare ORS when a child has diarrhea.Young child with diarrhea. Mother emptying ORS packet into a one-liter container.Mother: I am making this ORS for you to help you feel better. Don’t worry, you will feel better soon.Mother empties package, stirs solution and gives the child a reassuring look.
The child should continue to drink, be breastfed or eat soft foods.Father feeding the child porridge; bowl on the table with a banana and egg.Father: It is good to see you eating, my child. I know you must be hungry!While father feeds the child, the mother is in the background preparing supper for the rest of the family.
Any ORS not given to the child within 24 hours should be thrown away.Mother pouring ORS solution down drain. Child lying on father’s lap. Lamp on table.Mother: Time to make her some more ORS – this one has been sitting since yesterday.Local music playing softly in background, as if from radio.Mother takes pitcher from table to sink, empties it and begins making more solution.Father soothes child.

Adapted from Immunization and Child Health Materials Development Guide, PATH, 2001

Step 4: Ensure the Needed Hardware and Software

Ensure that the program or creative agency (if applicable) has the hardware and software needed to produce the materials per the agreement. Programs producing their own materials might need a computer, camera, video camera, audio recorder, microphone, smartphone or other hardware. The right software and applications are just as important and might include Word/Write, Photoshop, Illustrator, PowerPoint/Keynote presentation apps, Quicktime/iMovie, Sound Recorder/Garageband, YouTube, Twitter and others, depending on the medium and platform. Be sure to investigate what apps/software work on the platforms the program will use.

Step 5: Apply the 7 C’s of Effective Communication

The 7 C’s – principles for ensuring effective communication – apply in both message and materials development. While developing content, continually ask if it meets the 7 C’s:

7 C’sDescription
Command AttentionAttract and hold the audience’s attention. Use colors, images, key words and design elements that make the material stand out so that it is noticed and memorable.
Clarify the MessageEnsure the material conveys the message clearly, with easy-to-understand words and images.
Communicate a BenefitStress how the audience will benefit from adopting the new behavior.
Consistency CountsEnsure that content within and among materials does not conflict. Repeat messages throughout the materials. Re-use the same words and phrases, as appropriate. Also, re-use the same or related images and styles. This avoids confusion and repetition enhances the impact of the message.
Create TrustWell-developed materials encourage the audience to trust the organization or program using them. Trust and credibility allow and encourage the audience to heed the message.
Cater to the Heart and HeadPeople are swayed by both facts and emotions. Use both to maximize the material’s persuasiveness.
Call to ActionInclude a clear call to action in materials. Tell audience members precisely what they can do.

Step 6: Create Drafts

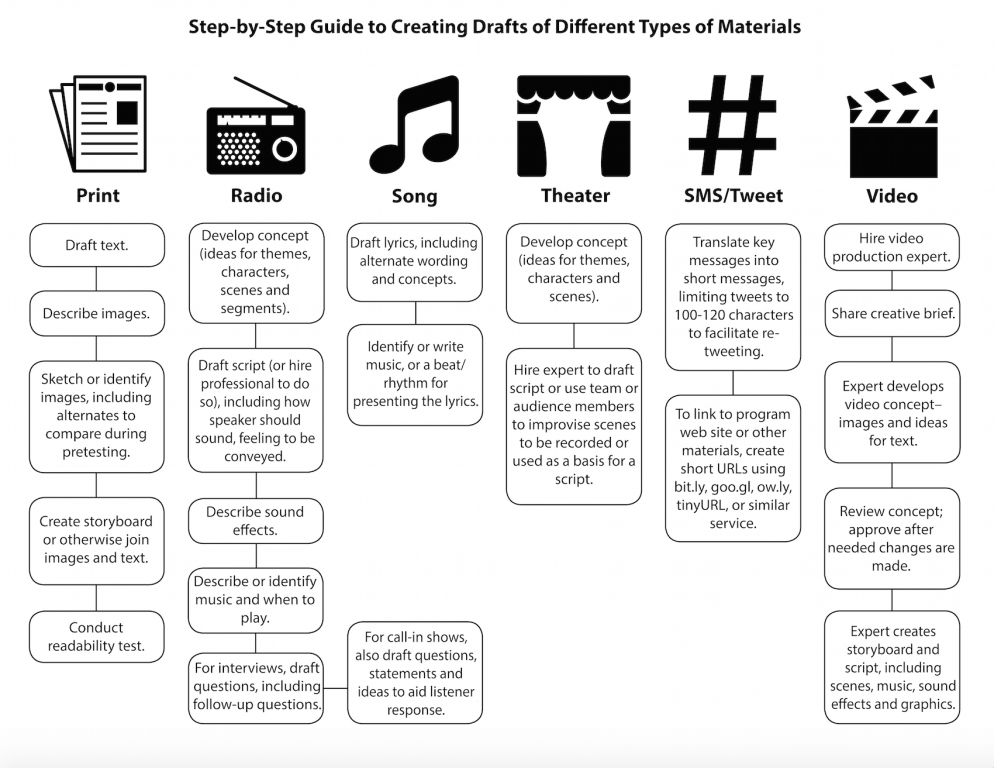
Use the flowchart below as a guide to create drafts of different types of materials. In addition to materials, programs might want to develop and test concepts, themes, slogans, tag lines, for use in and across SBCC materials and activities. See Resources for more detailed guidelines on creating various types of materials.

Step 7: Consider Expert Review for Accuracy

Before preparing the materials for pretesting, have a topic expert review them (for example, if the topic is malaria prevention, ask a malaria expert review the content). Implementing partners, collaborating agencies or other gatekeepers, such as Ministry staff, donors, and community leaders, might also need to review the drafts to ensure nothing is contrary to their policies or recommendations. Program staff might need to mediate between the need for precision, the need to satisfy gatekeepers and the need for audiences to understand and relate to the concept.

This step might have to be repeated after pretesting.

Step 8: Translate into Local Language

If not already developed in the language of the audience, have staff or a professional translator translate the material into the main language(s) used by the audience(s). Whenever possible, have a different person translate the translation back into the original language before pretesting in order to check the accuracy and nuances of the translation.

Step 9: Produce Materials

Materials should be pretested in their draft form. See the pretesting guide for guidance on pretesting draft materials and making revisions based on pretest results.

After pretesting and making revisions, produce the final materials.

Final production can be done in-house or by hiring company or consultant, depending on the material, budget and program capabilities. In cases where creative agencies or professionals are hired, they should be involved at every stage, starting from the initial creative design, and through the production stage. Use professionals for the highest quality print, radio and video materials. Use an experienced web/IT person/professional to upload files to the Internet and register URLs.

Work closely with whoever is producing the materials to ensure that the materials match the requirements in the creative brief and are produced on time and within budget. Review proofs (what the printer will use to print multiple copies) and rough-cuts. Beta test anything that will be accessed by phone, tablet or computer—ask potential users to access it on their own phone, tablet or computer.

See Resources for links to production tips for various types of SBCC materials.

Templates

Materials Development Worksheet

Storyboard Template

Samples

Postpartum Family Planning Materials Development Workshop

How To Write a Radio Serial Drama for Social Development: A Script Writer’s Manual

PSAs

Tips & Recommendations

  • If possible, use a variety of materials to appeal to audience segments at different times and in different ways.
  • Avoid clutter—any visual, aural and textual information that does not add meaning and could distract audience members from the message.
  • Ensure that the different content elements reinforce one other.
  • Instead of jargon, use simple language that the audience will understand and be able to re-use.
  • Convey the message as concisely as possible, but also using only the words and images that are truly necessary.
  • Respect the audience. Avoid talking down to the audience or using authoritarian language/tone.
  • Generally speaking, all of the materials in an SBCC effort or campaign should have consistent messaging, tone, feel, style, imagery, wording and approach. They should reinforce each other and any one material should remind the audience of the other materials in the effort.
  • Expand reach and access by including web links, telephone numbers and SMS/text codes where users can get additional information or otherwise interact with the health program.

Lessons Learned

  • Do not assume that low-literate audiences (and even others) understand symbols the way the project staff does. Common mistakes include using stop signs in materials for people who are not familiar with stop signs and x to mean “do not”.
  • The overall process of materials development should be the same, whether for IPC, community or mass media outputs. Developing activity guides, curricula, counseling algorithms and community event scripts requires following the same process as the one used for developing a TV spot, for example. IPC and community materials should adhere just as closely to the communication strategy and creative brief.
  • Following a structured materials development process helps ensure that the material are well-received by the priority audience, as well as those who influence whether and how they receive the materials.
  • Comprehensive planning is key. Ensure that the resources—human, technical, financial, time and material—are available to produce the quality, quantity and distribution of materials needed to effect change.
  • While hiring a creative agency might seem expensive, it can often save time and money in the long run and result in more effective materials.
  • While audiences like and need to see themselves in materials, sometimes they like to see others in the materials as well, so they do not feel that the problem or behavior applies only to them.

Glossary & Concepts

  • B-roll is the video footage developed by programs for use by news media (who usually use just a small amount of the footage in their story).
  • A beta test is the final test of a computer application before releasing it for public access. It gives access to the hopefully final product to a limited, but representative, number of people likely to use the application—giving them time to use it, identify glitches and provide feedback on usability (and other factors, as determined by staff).
  • The channel or medium is the means by which information is communicated.
  • E-zine is a web-based magazine.
  • Media mix is the combination of channels used to maximize the reach and effectiveness of SBCC efforts.
  • Readability is an assessment of the education level needed to understand a text. SMOG is one test that does not require a computer or Internet so it can be used in any setting. Other tests are available online and in programs, such as MS Word (under Spelling and Grammar, check “Check grammar,” then choose “Options,” find “Grammar,” and check “Show readability statistics”).
  • Rough-cut is a video or audio presentation that has not undergone a final edit; it gives an idea of what the final product could be.
  • Voice information tree is a telephone application that allows callers to press a number to get to a specific type of information

Resources and References

Resources

Working with a Creative Team

Writing Text to Reach Audiences for Lower Literacy Skills

The Value of Design

Visual and Web Design for Audiences with Lower Literacy Skills

SMOG Readability Test

The Health Communicator’s Social Media Toolkit

Theatre Facilitation Manual

mBCC Field Guide: A Resource for Developing Mobile Behavior Change Communication Programs

Simply Put: A Guide for Creating Easy-to-Understand Materials

Beyond the Brochure: Alternative Approaches to Effective Health Communication

Tips for Creating Print, Video, and Radio Materials

Using Mass Media for AIDS Prevention

References


Banner Photo: © 2013 Alison Heller/Washington University in Saint Louis, Courtesy of Photoshare

Introduction

Click here to access this Guide in Arabic

لمراجعة هذا الدليل باللغة العربية، انقر هنا

What is a Monitoring and Evaluation Plan?

A monitoring and evaluation (M&E) plan is a document that helps to track and assess the results of the interventions throughout the life of a program. It is a living document that should be referred to and updated on a regular basis. While the specifics of each program’s M&E plan will look different, they should all follow the same basic structure and include the same key elements.

An M&E plan will include some documents that may have been created during the program planning process, and some that will need to be created new. For example, elements such as the logic model/logical framework, theory of change, and monitoring indicators may have already been developed with input from key stakeholders and/or the program donor. The M&E plan takes those documents and develops a further plan for their implementation.

Why develop a Monitoring and Evaluation Plan?

It is important to develop an M&E plan before beginning any monitoring activities so that there is a clear plan for what questions about the program need to be answered. It will help program staff decide how they are going to collect data to track indicators, how monitoring data will be analyzed, and how the results of data collection will be disseminated both to the donor and internally among staff members for program improvement. Remember, M&E data alone is not useful until someone puts it to use! An M&E plan will help make sure data is being used efficiently to make programs as effective as possible and to be able to report on results at the end of the program.

Who should develop a Monitoring and Evaluation Plan?

An M&E plan should be developed by the research team or staff with research experience, with inputs from program staff involved in designing and implementing the program.

When should a Monitoring and Evaluation Plan be developed?

An M&E plan should be developed at the beginning of the program when the interventions are being designed. This will ensure there is a system in place to monitor the program and evaluate success.

Who is this guide for?

This guide is designed primarily for program managers or personnel who are not trained researchers themselves but who need to understand the rationale and process of conducting research. This guide can help managers to support the need for research and ensure that research staff have adequate resources to conduct the research that is needed to be certain that the program is evidence based and that results can be tracked over time and measured at the end of the program.

Learning Objectives

After completing the steps for developing an M&E plan, the team will:

  1. Identify the elements and steps of an M&E plan
  2. Explain how to create an M&E plan for an upcoming program
  3. Describe how to advocate for the creation and use of M&E plans for a program/organization

Estimated Time Needed

Developing an M&E plan can take up to a week, depending on the size of the team available to develop the plan, and whether a logic model and theory of change have already been designed.

Prerequisites

How to Develop a Logic Model

Steps

Step 1: Identify Program Goals and Objectives

The first step to creating an M&E plan is to identify the program goals and objectives. If the program already has a logic model or theory of change, then the program goals are most likely already defined. However, if not, the M&E plan is a great place to start. Identify the program goals and objectives.

Defining program goals starts with answering three questions:

  1. What problem is the program trying to solve?
  2. What steps are being taken to solve that problem?
  3. How will program staff know when the program has been successful in solving the problem?

​Answering these questions will help identify what the program is expected to do, and how staff will know whether or not it worked. For example, if the program is starting a condom distribution program for adolescents, the answers might look like this:

ProblemHigh rates of unintended pregnancy and sexually transmitted infections (STIs) transmission among youth ages 15-19
SolutionPromote and distribute free condoms in the community at youth-friendly locations
SuccessLowered rates of unintended pregnancy and STI transmission among youth 15-19. Higher percentage of condom use among sexually active youth.

From these answers, it can be seen that the overall program goal is to reduce the rates of unintended pregnancy and STI transmission in the community.

It is also necessary to develop intermediate outputs and objectives for the program to help track successful steps on the way to the overall program goal. More information about identifying these objectives can be found in the logic model guide.

Step 2: Define Indicators

Once the program’s goals and objectives are defined, it is time to define indicators for tracking progress towards achieving those goals. Program indicators should be a mix of those that measure process, or what is being done in the program, and those that measure outcomes.

Process indicators track the progress of the program. They help to answer the question, “Are activities being implemented as planned?” Some examples of process indicators are:

  • Number of trainings held with health providers
  • Number of outreach activities conducted at youth-friendly locations
  • Number of condoms distributed at youth-friendly locations
  • Percent of youth reached with condom use messages through the media

Outcome indicators track how successful program activities have been at achieving program objectives. They help to answer the question, “Have program activities made a difference?” Some examples of outcome indicators are:

  • Percent of youth using condoms during first intercourse
  • Number and percent of trained health providers offering family planning services to youth
  • Number and percent of new STI infections among youth.

These are just a few examples of indicators that can be created to track a program’s success. More information about creating indicators can be found in the How to Develop Indicators guide.

Step 3: Define Data Collection Methods and TImeline

After creating monitoring indicators, it is time to decide on methods for gathering data and how often various data will be recorded to track indicators. This should be a conversation between program staff, stakeholders, and donors. These methods will have important implications for what data collection methods will be used and how the results will be reported.

The source of monitoring data depends largely on what each indicator is trying to measure. The program will likely need multiple data sources to answer all of the programming questions. Below is a table that represents some examples of what data can be collected and how.

Information to be collectedData source(s)
Implementation process and progressProgram-specific M&E tools
Service statisticsFacility logs, referral cards
Reach and success of the program intervention within audience subgroups or communitiesSmall surveys with primary audience(s), such as provider interviews or client exit interviews
The reach of media interventions involved in the programMedia ratings data, brodcaster logs, Google analytics, omnibus surveys
Reach and success of the program intervention at the population levelNationally-representative surveys, Omnibus surveys, DHS data
Qualitative data about the outcomes of the interventionFocus groups, in-depth interviews, listener/viewer group discussions, individual media diaries, case studies

Once it is determined how data will be collected, it is also necessary to decide how often it will be collected. This will be affected by donor requirements, available resources, and the timeline of the intervention. Some data will be continuously gathered by the program (such as the number of trainings), but these will be recorded every six months or once a year, depending on the M&E plan. Other types of data depend on outside sources, such as clinic and DHS data.

After all of these questions have been answered, a table like the one below can be made to include in the M&E plan. This table can be printed out and all staff working on the program can refer to it so that everyone knows what data is needed and when.

IndicatorData source(s)Timing
Number of trainings held with health providersTraining attendance sheetsEvery 6 months
Number of outreach activities conducted at youth-friendly locationsActivity sheetEvery 6 months
Number of condoms distributed at youth-friendly locationsCondom distribution sheetEvery 6 months
Percent of youth receiving condom use messages through the mediaPopulation-based surveysAnnually
Percent of adolescents reporting condom use during first intercourseDHS or other population-based surveyAnnually
Number and percent of trained health providers offering family planning services to adolescentsFacility logsEvery 6 months
Number and percent of new STI infections among adolescentsDHS or other population-based surveyAnnually

Step 4: Identify M&E Roles and Responsibilities

The next element of the M&E plan is a section on roles and responsibilities. It is important to decide from the early planning stages who is responsible for collecting the data for each indicator. This will probably be a mix of M&E staff, research staff, and program staff. Everyone will need to work together to get data collected accurately and in a timely fashion.

Data management roles should be decided with input from all team members so everyone is on the same page and knows which indicators they are assigned. This way when it is time for reporting there are no surprises.

An easy way to put this into the M&E plan is to expand the indicators table with additional columns for who is responsible for each indicator, as shown below.

IndicatorData source(s)TimingData manager
Number of trainings held with health providersTraining attendance sheetsEvery 6 monthsActivity manager
Number of outreach activities conducted at youth-friendly locationsActivity sheetEvery 6 monthsActivity manager
Number of condoms distributed at youth-friendly locationsCondom distribution sheetEvery 6 monthsActivity manager
Percent of youth receiving condom use messages through the mediaPopulation-based surveyAnnuallyResearch assistant
Percent of adolescents reporting condom use during first intercourseDHS or other population-based surveyAnnuallyResearch assistant
Number and percent of trained health providers offering family planning services to adolescentsFacility logsEvery 6 monthsField M&E officer
Number and percent of new STI infections among adolescentsDHS or other population-based surveyAnnuallyResearch assistant

Step 5: Create an Analysis Plan and Reporting Templates

Once all of the data have been collected, someone will need to compile and analyze it to fill in a results table for internal review and external reporting. This is likely to be an in-house M&E manager or research assistant for the program.

The M&E plan should include a section with details about what data will be analyzed and how the results will be presented. Do research staff need to perform any statistical tests to get the needed answers? If so, what tests are they and what data will be used in them? What software program will be used to analyze data and make reporting tables? Excel? SPSS? These are important considerations.

Another good thing to include in the plan is a blank table for indicator reporting. These tables should outline the indicators, data, and time period of reporting. They can also include things like the indicator target, and how far the program has progressed towards that target. An example of a reporting table is below.

IndicatorBaselineYear 1Lifetime target% of target achieved
Number of trainings held with health providers051050%
Number of outreach activities conducted at youth-friendly locations02633%
Number of condoms distributed at youth-friendly locations025,00050,00050%
Percent of youth receiving condom use messages through the media.5%35%75%47%
Percent of adolescents reporting condom use during first intercourse20%30%80%38%
Number and percent of trained health providers offering family planning services to adolescents2010625080%
Number and percent of new STI infections among adolescents11,00022%10,00020%10% reduction 5 years20%

Step 6: Plan for Dissemination and Donor Reporting

The last element of the M&E plan describes how and to whom data will be disseminated. Data for data’s sake should not be the ultimate goal of M&E efforts. Data should always be collected for particular purposes.

Consider the following:

  • How will M&E data be used to inform staff and stakeholders about the success and progress of the program?
  • How will it be used to help staff make modifications and course corrections, as necessary?
  • How will the data be used to move the field forward and make program practices more effective?

The M&E plan should include plans for internal dissemination among the program team, as well as wider dissemination among stakeholders and donors. For example, a program team may want to review data on a monthly basis to make programmatic decisions and develop future workplans, while meetings with the donor to review data and program progress might occur quarterly or annually. Dissemination of printed or digital materials might occur at more frequent intervals. These options should be discussed with stakeholders and your team to determine reasonable expectations for data review and to develop plans for dissemination early in the program. If these plans are in place from the beginning and become routine for the project, meetings and other kinds of periodic review have a much better chance of being productive ones that everyone looks forward to.

Conclusion

After following these 6 steps, the outline of the M&E plan should look something like this:

  1. Introduction to program
    • ​Program goals and objectives
    • Logic model/Logical Framework/Theory of change
  2. ​​Indicators
    • Table with data sources, collection timing, and staff member responsible
  3. Roles and Responsibilities
    • Description of each staff member’s role in M&E data collection, analysis, and/or reporting
  4. ​Reporting
    • Analysis plan
    • Reporting template table
  5. Dissemination plan
    • Description of how and when M&E data will be disseminated internally and externally

Templates

M&E Planning: Template for Indicator Reporting

M&E Plan Indicators Table Template

Samples

M&E Plan: Data Sources Table Example

Tips & Recommendations

  • It is a good idea to try to avoid over-promising what data can be collected. It is better to collect fewer data well than a lot of data poorly. It is important for program staff to take a good look at the staff time and resource costs of data collection to see what is reasonable.

Glossary & Concepts

  • Process indicators track how the implementation of the program is progressing. They help to answer the question, “Are activities being implemented as planned?”
  • Outcome indicators track how successful program activities have been at achieving program goals. They help to answer the question, “Have program activities made a difference?”

Resources and References

References

Evaluation Toolbox. Step by Step Guide to Create your M&E Plan. Retrieved from: http://evaluationtoolbox.net.au/index.php?option=com_content&view=article&id=23:create-m-and-e-plan&catid=8:planning-your-evaluation&Itemid=44

infoDev. Developing a Monitoring and Evaluation Plan for ICT for Education. Retrieved from: https://www.infodev.org/infodev-files/resource/InfodevDocuments_287.pdf

FHI360. Developing a Monitoring and Evaluation Work Plan. Retrieved from: http://www.fhi360.org/sites/default/files/media/documents/Monitoring%20HIV-AIDS%20Programs%20(Facilitator)%20-%20Module%203.pdf


Banner Photo: © 2012 Akintunde Akinleye/NURHI, Courtesy of Photoshare

Introduction

What is an indicator?

Indicators are tools used to measure Social Behavior Change Communication (SBCC) program progress. They are used to assess the state of a program by defining its characteristics or variables, and then tracking changes in those characteristics over time or between groups. Clear indicators are the basis of any effective monitoring and evaluation system.

Why are indicators necessary?

In order to track the way in which an SBCC program evolves and its progress towards reaching certain goals you need to be able to measure this change over time. Indicators provide data that can be measured to show changes in relevant SBCC program areas.

While partners in the community and key stakeholders will help design an SBCC program, it is ultimately the responsibility of the organization to assess its success and report results to the donor. Indicators are used to create targets that allow program staff to measure up-to-date characteristics of the program’s success and assess whether those results are in line with program expectations. The indicators themselves are vital to this process, as they are the key for successful tracking of program changes or problems.

As a tracking device indicators alert managers to any needed mid-course adjustments if it is found that the program is having unexpected difficulties or going off track. At the end of the program they are measured to validate the success and achievements of the intervention.

Who should develop indicators?

Indictors should be developed by the research staff in close collaboration with program staff and any government or NGO counterparts who are designing the program and have clear knowledge of the program goals and objective. Once agreed uppn, indicators give all parties, program managers and personnel, researchers and key stakeholders, a common framework against which to measure the progress and success of the program over time.

When should indicators be developed?

Indicators should be developed at the beginning of SBCC programs and can help researchers and program managers track program progress over the life of the program as well as measuring the results of the program at the end.

Who is this guide for?

This guide is designed primarily for program managers or personnel who are not trained researchers themselves but who need to understand the rationale and process of conducting research. This guide can help managers to support the need for research and ensure that research staff have adequate resources to conduct the research that is needed to be certain that the program is evidence based and that results can be tracked over time and measured at the end of the program.

Learning Objectives

After completing the steps in the indicators guide, the team will:

1. Explain how to create indicators

2. Identify when to use indicators

3. Know how to set baselines and targets using indicators

Prerequisites

How to Develop a Logic Model and/or How to Develop a Theory of Change

How to Develop a Monitoring and Evaluation Plan

Steps

Step 1: Identify What to Measure

The first step to creating program indicators for monitoring and evaluation is to determine which characteristics of the program are most important to track. A program will use many indicators to assess different types and levels of change that result from the intervention, like changes in certain health knowledge, attitudes, and behaviors among the priority audience(s). Referring to the program’s logic model can help to identify key program areas that need to be included in monitoring indicators.

Indicators fall under the three stages of the logic model, which include:

  • Inputs – resources, contributions, and investments that go into a program
  • Outputs – activities, services, events and products that reach the priority audience(s)
  • Outcomes – results or changes for the priority audience(s)

Each stage of the logic model can use indicators to assess inputs, outputs, and outcomes. Process indicators consist of inputs as well as outputs and provide information about the scope and quality of activities implemented; these are considered monitoring indicators. Performance indicators include outcomes and are most commonly used to measure changes towards progress of results; these are considered evaluation indicators.

Step 2: Use the SMART Process to Develop High-Quality Indicators

One way to develop good indicators is to use the SMART criteria, as explained below. Consider each of these points when developing new indicators or revising old ones.

  • Specific: The indicator should accurately describe what is intended to be measured, and should not include multiple measurements in one indicator.
  • Measurable: Regardless of who uses the indicator, consistent results should be obtained and tracked under the same conditions.
  • Attainable: Collecting data for the indicator should be simple, straightforward, and cost-effective.
  • Relevant: The indicator should be closely connected with each respective input, output or outcome.
  • Time-bound: The indicator should include a specific time frame.
Implemented between 2008 and 2011 in Tanzania, the Fataki Campaign was designed to address the potential risk of HIV exposure in intergenerational relationships, through which older men offer young women financial or material goods in exchange for sex. This campaign included various mass-media and community-based activities. The monitoring and evaluation process for this campaign used multiple indicators to track the progress of the intervention, including ones used to track community discussions about Fatakis. One such indicator is used in the example below. Note how much the indicator improves through this SMART process.

The example below uses the SMART approach to improve an indicator related to family planning.

1. What is the input/output/outcome being measured?Outcome: An increase in interpersonal communication about cross-generational sex as a result of the Fataki campaign
2. What is the proposed indicator?Percent that have talked to someone about cross-generational sex.
3. Is this indicator specific?It describes what people are talking about but does not specify the audience to be measured or who they are talking to. The indicator should include the percent of what population have talked to who? about cross-generational sex.
4. Is this indicator measurable?Yes, but additional refinement would make it easier to replicate over time. Some participants may discuss cross-generational sex even if they were not exposed to the Fataki Campaign. A better way to assess this would be to change discussion about cross-generational sex to discussion about a “Fataki” message. Also, interpersonal communication implies a two-way discussion. Therefore, the indicator should include “discussed with” rather than “talked to.”
5. Is the indicator attainable?This indicator is attainable because data for this indicator will be collected through a question in a larger, project-funded survey.
6. Is the indicator relevant and related to the input/output/outcome being measured?This is directly related to the outcome as individuals who have talked to someone about cross-generational sex have likely participated either directly or indirectly in interpersonal communication about the campaign.
7. Is this indicator time-bound?This indicator is implicitly time-bound, but not explicitly. The word “ever” or “in the last three months” should be added to clarify the time frame.
8. Based on answers to the above questions, what is the revised proposed indicator?Percent of community members that have discussed a “Fataki” message in the last three months with another person in the community.

Step 3: Establish a Reference Point

To show change or progress in a program, a reference point must be established. A reference point is a point before, during, or at the end of a program where indicators are used to establish the state of the program in terms of the audience’s knowledge, attitudes or behavior in order to provide a point of comparison as the program progresses. The reference point is often chosen before or at the start of a program to assess the progress of the program over time. At the same time, implementation timelines do not always allow for baseline data to be collected. In these cases reference points can be set up at other times in the program.

Depending on the stage of the intervention, a reference group can be established in one of several ways (see Figure 1 in Step 5):

Intervention has not begunIntervention has begunIntervention is over
Establish the reference point immediately before it begins. This point is usually referred to as a baseline.See if any data related to the program indicators were collected in other surveys targeting similar populations. For example, use data from large-scale national surveys like DHS.A reference point can be established through a control group. Identify a sample group that has not been exposed to the intervention and is demographically, geographically, cuturally, and socially similar to the intervention group. Then administer data collection on program indicators with this group.
If comparable measurements in other surveys/programs cannot be found, use the program indicators to collect data on the current state of the program, even if it has already begun.

For example, the Fataki campaign described earlier chose to establish a reference point through a control group, which was then compared to those who were exposed to the Fataki campaign. This method is an acceptable way of evaluating a program, although it creates complications when used for ongoing monitoring.

Step 4: Set Targets

Targets define the path and end destination of what a program hopes to achieve and is a number or percentage which will measure success. Once the reference point is established, determine what changes should be seen in the program’s indicators that would reflect progress towards success.

When establishing targets, consider:

  • Baseline data or reference point: This sets a certain point in time in the program from which to observe change over time.
  • Stakeholder’s expectations: Understanding the expectations of key stakeholders and partners can help set reasonable expectations for what can be achieved.
  • Recent research findings: Do a literature search, if literature is available, for the latest findings about local conditions and the program sector, or conduct FGDs or IDIs in order to set realistic targets.
  • Accomplishments of similar programs: Identify relevant information on similar programs that have been implemented under comparable conditions. Those with a reputation for high performance can often provide critical input on setting targets.

The table below provides an example of how to visually organize inputs/outputs/outcomes, indicators, reference points and targets, using the same Fataki campaign described earlier. Making a table like the one below can provide a method for tracking the progress of the program and understanding how each indicator, reference point, and target fits with the logic model.

Input/Output/OutcomeIndicatorReference pointTarget
Output: An increase in interpersonal communication about cross-generational sex as a result of the Fataki campaign.Percent of community members that have ever discussed a “Fataki” message with another person in the community.Among those not exposed to the Fataki campaign, 0% have discussed a “Fataki” message with someone.Among those who have been exposed to the Fataki campaign, 65% have discussed a “Fataki” message with someone.

Step 5: Determine the Frequency of Data Collection

As a last step, consider how often data should be collected in order to properly track the program’s progress. These designated points in time are usually referred to as benchmarks. Ideally, at least one round of data collection should occur between the reference point and the end of the program. If the data are collected at the midpoint of the program, it is called a midline. If data are collected at the end of the program, it is called an endline (see Figure 1). In the Fataki example, only endline data was collected. The frequency of collecting data is mostly dependent on the cost and length of the program — longer programs, or those with more funding, can typically collect comprehensive data more frequently than shorter programs or those with less funding.

Figure 1

Conclusion

Proper indicators are crucial to any program as they provide data needed to track program progress. By closely tracking the progress of a program, any problems can be quickly identified and addressed. Being able to address problems in a timely manner can help improve programs and ensure better results. Better results allows for informed progress reports grounded in evidence, which help prove the effectiveness of a program to current and future funders.

In order to make the most out of indicators, they should be “SMART” (Specific, Measurable, Attainable, Relevant, and Time-Bound) and establish a point of reference, targets, and frequency of data collection for effective program monitoring and evaluation.

Templates

Developing Indicators: A SMART Criteria Checklist

Tips & Recommendations

  • Remember no indicator will meet all of the SMART criteria equally. Use discretion in determining what will provide a balance between validity and practicality.
  • Although the interests of stakeholders are critical to selecting proper indicators, this does not mean that indicators must be created to capture every stakeholder concern. The managers of the program must use their best judgment to include stakeholder interests where possible and appropriate.

Glossary & Concepts

  • Inputs include the resources, contributions, and investments that go into a program

  • Outputs are the activities, services, events and products that reach the program’s primary audience

  • Outcomes are the results or changes related to the program’s intervention that are experienced by the primary audience

  • Process indicators provide information about the scope and quality of activities implemented, and consist of inputs as well as outputs; these are considered monitoring indicators.

  • Performance indicators are most commonly used to measure changes towards progress of results, and include outcomes; these are considered evaluation indicators.

  • Reference point is a point before, during, or at the end of a program where indicators are used to establish program characteristics in order to provide a point of comparison as the program progresses.

  • Targets are pre-established goals that are set for the program.

  • Benchmarks are designated points in time in which data are collected to track the program’s progress

  • Midline refers to data collected at the mid point of a program

  • Endline refers to data collected at the end of a program

Resources and References

References

Global Fund. Monitoring and Evaluation Toolkit: HIV, Tuberculosis, Malaria, and Health and Community Systems Strengthening.

Institutionalizing Learning. Designing for Results: Integrating Monitoring and Evaluation in Conflict Transformation Programs.

UNAIDS. Monitoring and Evaluating Fundamentals. An Introduction to Indicators.

UNDP. Selecting Indicators for Impact Evaluation

Kusek, J.Z., & Rist, R.C. (2004). Ten Steps to a Results-Based Monitoring and Evaluation System: Planning for Improving – Selecting Results Targets.


Banner Photo: © 2007 Bonnie Gillespie, Courtesy of Photoshare